

Investing
Why Crypto Volumes Are Falling Despite North America Adoption

Spot volume down 40% Q4 2025 to Q1 2026. But Bitcoin ETF AUM hit $179.5B by mid-2025. The US ranked #2 in global adoption. 76.9% of North America’s crypto transactions are $1M+ transfers. The paradox has a structural explanation.
Spot trading volume on the top ten centralised crypto exchanges fell from $4.5 trillion in Q4 2025 to $2.7 trillion in Q1 2026. That is a 40% decline in a single quarter. At the same time, the United States ranked second in the Chainalysis 2025 Global Crypto Adoption Index. North America processed $2.3 trillion in on-chain cryptocurrency value between July 2024 and June 2025 — 26% of all global activity. Bitcoin ETFs reached $179.5 billion in assets under management by mid-2025. These two data sets appear to contradict each other. They do not. The apparent paradox — falling spot volume alongside rising adoption — is the result of a fundamental structural shift in how North American investors access cryptocurrency. A retail investor buying a Bitcoin ETF through their brokerage account is not generating spot exchange volume. An institution using derivatives to hedge a crypto position is not generating spot exchange volume. A family office holding tokenised US Treasuries as DeFi collateral is not generating spot exchange volume. All of them are participating in the crypto ecosystem in ways that the spot exchange volume metric simply cannot see. This article explains the mechanism, the data, and what the falling volume number actually tells us.
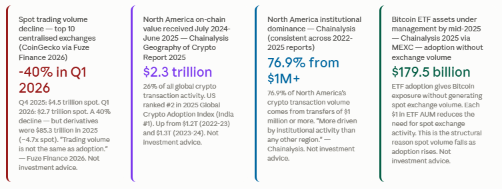
Q4 2025 spot trading volume (top 10 CEXs): $4.5 trillion (CoinGecko via Fuze Finance 2026). Q1 2026 spot volume: $2.7 trillion — a 40% decline. North America: $2.3 trillion in crypto value July 2024-June 2025 = 26% of global activity (Chainalysis 2025). Bitcoin ETF AUM: $179.5 billion mid-2025 (Chainalysis via MEXC). US ranked #2 in 2025 Global Crypto Adoption Index (Chainalysis via Fuze Finance). .
76.9% of North America's transaction volume driven by transfers of $1 million or more (Chainalysis — consistent across multiple annual reports). North American crypto is 'more driven by institutional activity than any other region' (Chainalysis). Monthly growth swings in North America: from -35% (September 2024) to +84% (November 2024) — pointing to heavy institutional involvement vs steadier utility-driven regions (Chainalysis via MEXC).
Bitcoin ETF AUM: $179.5 billion by mid-2025 (Chainalysis 2025 via MEXC). ETFs and tokenization 'drive adoption' while spot exchange volume declines (Chainalysis 2025 via Yahoo Finance/Coinspeaker). Fuze Finance 2026: 'North America growth driven by institutional participation, Bitcoin ETFs, and improving regulatory clarity.' Tokenized US Treasuries also growing as yield-bearing crypto-native collateral (Chainalysis 2025).
Perpetual futures derivatives volume 2025: approximately $85.3 trillion (CoinGecko via Fuze Finance 2026). Spot volume (top 10 CEXs): approximately $18T annualised. Ratio: derivatives approximately 4.7x spot. 'Derivatives continue to dominate overall crypto trading activity' (Fuze Finance 2026).
The top 10 centralised exchanges recorded $2.7 trillion in spot trading volume during Q1 2026, down from $4.5 trillion in Q4 2025 — a 40% decline, according to CoinGecko data compiled by Fuze Finance 2026. There are several structural explanations. First, Bitcoin ETFs allow institutional and retail investors to gain exposure to Bitcoin without trading on spot exchanges — reducing spot exchange activity while increasing actual adoption. Second, institutional investors (who dominate North American crypto at 76.9% of volume per Chainalysis) increasingly use derivatives rather than spot trading to manage and express their positions. Third, Q4 2025 may have been a period of elevated spot activity that is naturally consolidating. The broader adoption picture is not declining — the US ranked second in the 2025 Chainalysis Global Crypto Adoption Index.
Does falling spot volume mean crypto adoption is declining in North America?
No — the data explicitly contradicts this interpretation. North America received $2.3 trillion in on-chain cryptocurrency value between July 2024 and June 2025, representing 26% of all global transaction activity (Chainalysis 2025). The US ranked second in the 2025 Global Crypto Adoption Index. Bitcoin ETF assets under management reached $179.5 billion by mid-2025. Fuze Finance's 2026 crypto statistics guide states this explicitly: 'Trading volume is not the same as adoption. Countries with the highest adoption aren't always those with the highest trading volumes.' The adoption structure in North America has shifted toward institutional vehicles (ETFs, derivatives, tokenized assets) that generate adoption without generating spot exchange volume.
What is driving North American crypto adoption if not retail spot trading?
Three drivers are identified by Fuze Finance's 2026 analysis citing Chainalysis: institutional participation, Bitcoin ETFs, and improving regulatory clarity. Bitcoin ETFs accumulated $179.5 billion in AUM by mid-2025 (Chainalysis via MEXC). Tokenized US Treasuries are growing as yield-bearing instruments used as DeFi collateral (Chainalysis 2025 via Yahoo Finance/Coinspeaker). Traditional financial institutions — banks, asset managers, pension funds — are 'taking serious positions in the crypto space' (Chainalysis 2024 via CrowdFundInsider). Stablecoins processed nearly $16 trillion in 2025. 76.9% of North American crypto volume comes from $1M+ transfers — the institutional signature.
Why are derivatives volumes so much larger than spot volumes?
CoinGecko data compiled by Fuze Finance 2026 shows perpetual futures derivatives processed approximately $85.3 trillion in 2025, while spot volume on top exchanges ran at approximately $4.5 trillion per quarter. Derivatives are roughly 4.7 times larger than spot volume. Derivatives allow participants to express directional views, hedge positions, and manage risk with capital efficiency that spot trading does not provide. Institutional participants — who dominate North American crypto — prefer derivatives for risk management purposes. Fuze Finance notes: 'Derivatives continue to dominate overall crypto trading activity.' The large derivatives-to-spot ratio reflects market sophistication and institutional participation, not retail speculation.
What role did regulatory clarity play in changing North America's crypto volume profile?
Improving regulatory clarity in the US is identified by multiple sources as a key driver of adoption pattern changes. The approval of Bitcoin spot ETFs created a regulated, accessible vehicle for institutional participation that bypasses spot exchanges. Chainalysis's 2025 report (via Yahoo Finance/Coinspeaker) notes that North American activity 'was influenced by a more favorable regulatory outlook and institutional trading strategies.' Statista's North America cryptocurrency outlook notes that 'regulatory clarity in key markets like the U.S.' drove renewed momentum in 2025. CrowdFundInsider's coverage of the Chainalysis 2024 report identified that North America made a 'remarkable recovery' from the post-FTX period partly because regulatory clarity enabled institutional re-entry. The paradox: more regulatory clarity can mean less spot exchange volume (as regulated vehicles like ETFs absorb activity) while simultaneously meaning more adoption.
Spot trading volume on the top ten centralised crypto exchanges fell from $4.5 trillion in Q4 2025 to $2.7 trillion in Q1 2026. That is a 40% decline in a single quarter. At the same time, the United States ranked second in the Chainalysis 2025 Global Crypto Adoption Index. North America processed $2.3 trillion in on-chain cryptocurrency value between July 2024 and June 2025 — 26% of all global activity. Bitcoin ETFs reached $179.5 billion in assets under management by mid-2025. These two data sets appear to contradict each other. They do not. The apparent paradox — falling spot volume alongside rising adoption — is the result of a fundamental structural shift in how North American investors access cryptocurrency. A retail investor buying a Bitcoin ETF through their brokerage account is not generating spot exchange volume. An institution using derivatives to hedge a crypto position is not generating spot exchange volume. A family office holding tokenised US Treasuries as DeFi collateral is not generating spot exchange volume. All of them are participating in the crypto ecosystem in ways that the spot exchange volume metric simply cannot see. This article explains the mechanism, the data, and what the falling volume number actually tells us.
Table of Contents
- The Volume Drop That Is Not What It Looks Like
- The Institutional Dominance Explanation
- The ETF Effect: Adoption Without Exchange Volume
- Derivatives: Where the Real Volume Lives
- Adoption vs Volume: The Regional Comparison That Clarifies Everything
- North America’s Crypto Trajectory: Three Years of Data
- What Falling Spot Volume Does and Does Not Mean
- Conclusion: The Metric That Cannot See the Market It Is Measuring
- Frequently Asked Questions
The Volume Drop That Is Not What It Looks Like
The headline is dissonant. In Q4 2025, the top ten centralised exchanges recorded $4.5 trillion in spot trading volume. By Q1 2026, that figure had fallen to $2.7 trillion — a 40% decline in a single quarter, according to CoinGecko data compiled by Fuze Finance in 2026. At the same time, the United States ranked second in the Chainalysis 2025 Global Crypto Adoption Index. North America received $2.3 trillion in cryptocurrency value between July 2024 and June 2025, representing 26% of all global transaction activity. Bitcoin ETFs had accumulated $179.5 billion in assets under management by mid-2025. The region’s crypto market is, by Chainalysis’s own description, ‘driven by institutional activity more than any other region.’ These two things appear contradictory. Spot volume is falling while institutional adoption is rising. Grassroots usage metrics are improving while exchange trading volume declines. The paradox is real — but it is not a contradiction. It is a structural shift in how North Americans access and hold cryptocurrency, and understanding the mechanics of that shift explains both the volume drop and the continued adoption growth simultaneously. The core finding, stated explicitly by Fuze Finance in their 2026 crypto trading statistics guide: ‘Trading volume is not the same as adoption. Countries with the highest adoption aren’t always those with the highest trading volumes.Q4 2025 spot trading volume (top 10 CEXs): $4.5 trillion (CoinGecko via Fuze Finance 2026). Q1 2026 spot volume: $2.7 trillion — a 40% decline. North America: $2.3 trillion in crypto value July 2024-June 2025 = 26% of global activity (Chainalysis 2025). Bitcoin ETF AUM: $179.5 billion mid-2025 (Chainalysis via MEXC). US ranked #2 in 2025 Global Crypto Adoption Index (Chainalysis via Fuze Finance). .
The Institutional Dominance Explanation
The single most important structural fact about North American crypto markets is one that has remained consistent across multiple years of Chainalysis reporting: 76.9% of the region’s transaction volume is driven by transfers of $1 million or more. This is not a feature of every crypto market. It is specific to North America. As Chainalysis noted in its analysis: ‘North America’s crypto market is more driven by institutional activity than any other region’s.’ The Block’s reporting on Chainalysis data makes the contrast explicit: in regions where crypto is more utility-driven — used for remittances, peer-to-peer transactions, inflation hedging, and everyday commerce — adoption patterns are steadier and more granular. Millions of small transactions. In North America, the pattern is different: fewer, larger transactions, dominated by institutional actors who manage positions through derivatives rather than repetitive spot buying and selling. This distinction matters because it explains why spot exchange volume can fall while adoption grows. An institution that bought $500 million of Bitcoin via a spot ETF in Q4 2025 does not need to trade on Binance or Coinbase to express that position. The ETF holds the Bitcoin. The institution holds the ETF. The underlying adoption — exposure to Bitcoin, belief in its value, capital allocation into the asset class — is real. But it is invisible to the spot exchange volume metric.76.9% of North America's transaction volume driven by transfers of $1 million or more (Chainalysis — consistent across multiple annual reports). North American crypto is 'more driven by institutional activity than any other region' (Chainalysis). Monthly growth swings in North America: from -35% (September 2024) to +84% (November 2024) — pointing to heavy institutional involvement vs steadier utility-driven regions (Chainalysis via MEXC).
The ETF Effect: Adoption Without Exchange Volume
The approval of Bitcoin spot ETFs in the United States represents the single most significant structural change to the North American crypto market in recent years. By mid-2025, Bitcoin ETFs had accumulated $179.5 billion in assets under management according to Chainalysis data cited by MEXC. This is adoption at scale. But it is adoption that bypasses the spot cryptocurrency exchange entirely. When a pension fund, family office, or retail investor buys shares of a Bitcoin ETF, they are gaining economic exposure to Bitcoin without ever touching a centralised exchange like Coinbase, Kraken, or Binance. The ETF sponsor purchases Bitcoin on the spot market — so there is some spot market activity — but the subsequent trading of ETF shares happens on the stock exchange, not a cryptocurrency exchange. The volume metric that captures exchange spot trading does not capture this activity. Fuze Finance’s 2026 analysis of crypto trading statistics makes the causal link explicit: ‘In North America, growth has been driven largely by institutional participation, Bitcoin ETFs, and improving regulatory clarity.’ The same report identifies that the top 10 centralised exchanges saw spot volume fall from $4.5 trillion in Q4 2025 to $2.7 trillion in Q1 2026 — precisely during a period when ETF adoption was accelerating. These two trends are not in tension. One is the cause of the other. ETF adoption is a mechanism by which institutional investors access Bitcoin in a way that reduces their need for spot exchange participation.Bitcoin ETF AUM: $179.5 billion by mid-2025 (Chainalysis 2025 via MEXC). ETFs and tokenization 'drive adoption' while spot exchange volume declines (Chainalysis 2025 via Yahoo Finance/Coinspeaker). Fuze Finance 2026: 'North America growth driven by institutional participation, Bitcoin ETFs, and improving regulatory clarity.' Tokenized US Treasuries also growing as yield-bearing crypto-native collateral (Chainalysis 2025).
Derivatives: Where the Real Volume Lives
There is a second volume metric that the falling-spot-volume headline consistently ignores. CoinGecko data compiled by Fuze Finance reports that perpetual futures exchanges processed approximately $85.3 trillion in trading volume during 2025 alone. That is not a typo. While spot volume on the top ten centralised exchanges was running at approximately $4.5 trillion per quarter (approximately $18 trillion annually if constant), derivatives volume was $85.3 trillion for the full year. The ratio of derivatives to spot volume is approximately 4.7:1. This is relevant to the North American volume question for two reasons. First, institutional investors who dominate North American crypto activity are disproportionate users of derivatives instruments to express views, hedge positions, and manage risk — activities that generate derivatives volume rather than spot volume. Second, the derivatives market’s continued scale indicates that sophisticated market participants have not left the crypto ecosystem. They have shifted their activity to a venue that better serves their risk management needs. Fuze Finance notes the pattern directly: ‘Derivatives continue to dominate overall crypto trading activity.’ A falling spot volume number that coexists with $85.3 trillion in annual derivatives volume is not a market in retreat. It is a market maturing from retail-driven spot speculation toward institutional derivatives management and ETF-accessed long-term allocation.Perpetual futures derivatives volume 2025: approximately $85.3 trillion (CoinGecko via Fuze Finance 2026). Spot volume (top 10 CEXs): approximately $18T annualised. Ratio: derivatives approximately 4.7x spot. 'Derivatives continue to dominate overall crypto trading activity' (Fuze Finance 2026).
Adoption vs Volume: The Regional Comparison That Clarifies Everything
Chainalysis’s 2025 Global Crypto Adoption Index illustrates the adoption-versus-volume disconnect most clearly by looking at which countries top the index. India ranked first. The United States ranked second. These two countries represent structurally opposite crypto use cases. In India, crypto adoption is broad-based and grassroots — many people making many small transactions, driven by remittance flows, inflation hedging, peer-to-peer trading, and utility use of stablecoins. This generates consistent, granular, everyday transaction volume. In the United States, crypto adoption is driven by a smaller number of participants making very large transactions, primarily through institutional vehicles, ETFs, and derivatives. Monthly North American growth figures swing dramatically — from a 35% decline in September 2024 to an 84% jump in November 2024 according to Chainalysis data via MEXC — because a handful of institutional decisions can dominate the statistics in ways that grassroots retail activity never could. The adoption is real on both sides. The volume profiles are entirely different. As Fuze Finance’s 2026 statistics guide explicitly states: ‘Businesses should avoid treating trading volume as a direct measure of adoption.’ The falling spot volume in North America in Q1 2026 is not evidence of waning adoption. It is evidence of an adoption model that no longer primarily expresses itself through centralised exchange spot trading. US ranked #2, India #1 in 2025 Chainalysis Global Crypto Adoption Index (Fuze Finance 2026 citing Chainalysis). 'Countries with the highest adoption aren't always those with the highest trading volumes' (Fuze Finance 2026). North America monthly volatility: -35% September 2024 to +84% November 2024 — institutional-driven swings (Chainalysis via MEXC). North America: 26% of global on-chain activity, $2.3 trillion July 2024-June 2025 (Chainalysis 2025 via Coinspeaker/Yahoo Finance).North America’s Crypto Trajectory: Three Years of Data
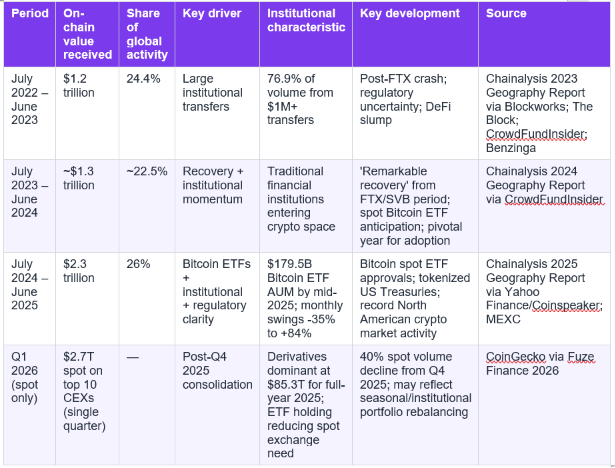
The Chainalysis annual Geography of Crypto reports provide a consistent three-year dataset on North American crypto activity that shows the actual trajectory — one of recovery and growth, not decline. The following table consolidates the key data points from each annual report. Not investment advice.
What Falling Spot Volume Does and Does Not Mean
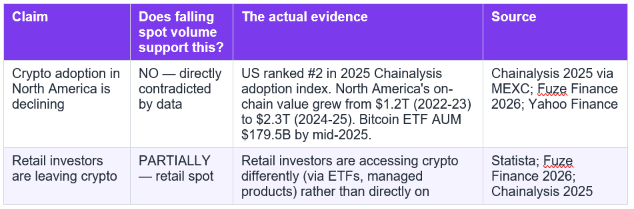
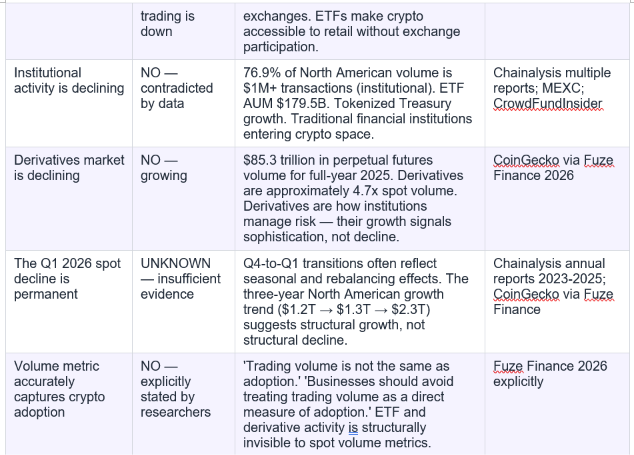
The distinction between what the spot volume decline signals and what it does not is important for interpreting current market conditions correctly. Not investment advice.
Conclusion
Spot exchange trading volume is one of the oldest and most-cited metrics in crypto markets. It is also, increasingly, one of the least complete measures of what is actually happening in the most institutionally developed crypto markets. The Chainalysis Geography of Crypto 2025 report shows North America receiving $2.3 trillion in on-chain value — up from $1.2 trillion two years prior — while the US ranks second in global adoption. Bitcoin ETFs have accumulated $179.5 billion in assets under management. Stablecoins processed nearly $16 trillion in transfers in 2025. Derivatives markets processed $85.3 trillion. The spot volume decline from $4.5 trillion in Q4 2025 to $2.7 trillion in Q1 2026 is real. But it is reading a channel that institutional adoption specifically bypasses. As Fuze Finance’s 2026 analysis states directly: ‘Crypto adoption is growing worldwide, but the reasons behind that growth vary from region to region. In North America, growth has been driven largely by institutional participation, Bitcoin ETFs, and improving regulatory clarity.’ None of those three drivers generate spot exchange volume in the way that retail speculation does. The market that spot volume used to capture was dominated by retail traders repeatedly buying and selling on centralised exchanges. The market that exists now in North America is dominated by institutional participants managing positions through ETFs, derivatives, and on-chain protocols. The metric has not changed. The market has. This is not financial, investment, or crypto advice.Frequently Asked Questions
Why is crypto spot trading volume falling in 2026?The top 10 centralised exchanges recorded $2.7 trillion in spot trading volume during Q1 2026, down from $4.5 trillion in Q4 2025 — a 40% decline, according to CoinGecko data compiled by Fuze Finance 2026. There are several structural explanations. First, Bitcoin ETFs allow institutional and retail investors to gain exposure to Bitcoin without trading on spot exchanges — reducing spot exchange activity while increasing actual adoption. Second, institutional investors (who dominate North American crypto at 76.9% of volume per Chainalysis) increasingly use derivatives rather than spot trading to manage and express their positions. Third, Q4 2025 may have been a period of elevated spot activity that is naturally consolidating. The broader adoption picture is not declining — the US ranked second in the 2025 Chainalysis Global Crypto Adoption Index.
Does falling spot volume mean crypto adoption is declining in North America?
No — the data explicitly contradicts this interpretation. North America received $2.3 trillion in on-chain cryptocurrency value between July 2024 and June 2025, representing 26% of all global transaction activity (Chainalysis 2025). The US ranked second in the 2025 Global Crypto Adoption Index. Bitcoin ETF assets under management reached $179.5 billion by mid-2025. Fuze Finance's 2026 crypto statistics guide states this explicitly: 'Trading volume is not the same as adoption. Countries with the highest adoption aren't always those with the highest trading volumes.' The adoption structure in North America has shifted toward institutional vehicles (ETFs, derivatives, tokenized assets) that generate adoption without generating spot exchange volume.
What is driving North American crypto adoption if not retail spot trading?
Three drivers are identified by Fuze Finance's 2026 analysis citing Chainalysis: institutional participation, Bitcoin ETFs, and improving regulatory clarity. Bitcoin ETFs accumulated $179.5 billion in AUM by mid-2025 (Chainalysis via MEXC). Tokenized US Treasuries are growing as yield-bearing instruments used as DeFi collateral (Chainalysis 2025 via Yahoo Finance/Coinspeaker). Traditional financial institutions — banks, asset managers, pension funds — are 'taking serious positions in the crypto space' (Chainalysis 2024 via CrowdFundInsider). Stablecoins processed nearly $16 trillion in 2025. 76.9% of North American crypto volume comes from $1M+ transfers — the institutional signature.
Why are derivatives volumes so much larger than spot volumes?
CoinGecko data compiled by Fuze Finance 2026 shows perpetual futures derivatives processed approximately $85.3 trillion in 2025, while spot volume on top exchanges ran at approximately $4.5 trillion per quarter. Derivatives are roughly 4.7 times larger than spot volume. Derivatives allow participants to express directional views, hedge positions, and manage risk with capital efficiency that spot trading does not provide. Institutional participants — who dominate North American crypto — prefer derivatives for risk management purposes. Fuze Finance notes: 'Derivatives continue to dominate overall crypto trading activity.' The large derivatives-to-spot ratio reflects market sophistication and institutional participation, not retail speculation.
What role did regulatory clarity play in changing North America's crypto volume profile?
Improving regulatory clarity in the US is identified by multiple sources as a key driver of adoption pattern changes. The approval of Bitcoin spot ETFs created a regulated, accessible vehicle for institutional participation that bypasses spot exchanges. Chainalysis's 2025 report (via Yahoo Finance/Coinspeaker) notes that North American activity 'was influenced by a more favorable regulatory outlook and institutional trading strategies.' Statista's North America cryptocurrency outlook notes that 'regulatory clarity in key markets like the U.S.' drove renewed momentum in 2025. CrowdFundInsider's coverage of the Chainalysis 2024 report identified that North America made a 'remarkable recovery' from the post-FTX period partly because regulatory clarity enabled institutional re-entry. The paradox: more regulatory clarity can mean less spot exchange volume (as regulated vehicles like ETFs absorb activity) while simultaneously meaning more adoption.
0 Comments
Be the first to share your thoughts on this article.