

Retirement
Dividend Barbell Rule in Retirement With ETFs

Retirement investing has a fundamental tension in it that no single ETF resolves cleanly. You need income today — real money landing in your account this month to pay the mortgage, the food bill, and the healthcare premium. But you also need income that grows over time, because the income that feels comfortable in year one of retirement will be noticeably less comfortable in year fifteen if inflation has been eroding its real value every year. The dividend barbell strategy addresses both ends of that problem simultaneously. It pairs high-yield ETFs that generate generous income right now with dividend growth ETFs that expand the portfolio’s earning power year after year. As Kiplinger puts it: ‘Rather than viewing these ETFs as competing strategies, investors can combine them in a dividend barbell portfolio.’ This article explains the barbell framework, introduces the four ETFs most commonly used to build one — SCHD, VYM, JEPI, and JEPQ — and gives you the numbers to decide how to allocate between them.
Walk into retirement with a simple dividend income strategy and you face a choice that feels like it shouldn’t exist. You can chase high yield — an ETF that throws off 8% in distributions every year, paid monthly, reliable and generous. The problem: that high yield often comes from a covered-call strategy that caps the ETF’s upside in strong markets and whose distributions have been declining in real terms. In ten years, you may be collecting 8% of a portfolio that hasn’t grown much, while the cost of living has climbed steadily above what that income covers.
Or you can choose the dividend growth path — an ETF with a 3% yield today that grows its distributions at 10-11% per year. Patient, compounding, inflation-beating. The problem: a 3% yield on a $500,000 portfolio is $15,000 per year. That is $1,250 per month. For many retirees, that does not cover basic expenses without drawing down the principal, which is exactly what you were trying to avoid.
The barbell does not choose between these two paths. It runs both simultaneously. The high-yield side covers your income needs right now. The dividend growth side builds the earning power that will cover your income needs in fifteen years. As 247 Wall St described it in July 2026: the four ETFs in a barbell portfolio provide ‘monthly cash flow, growing income, and total return growth’ — covering all three things a retirement portfolio actually needs. Not financial advice.
The retirement income tension in numbers (2026): SCHD yield: ~3.06-3.44% (quarterly; dividend growth ~11%/year 5-year average). JEPI yield: ~7.93-8.27% (monthly; distribution CAGR -8.76% over 3 years — declining). On $500K: SCHD alone = ~$16,500/year. JEPI alone = ~$40,000/year (but growth-limited and tax-inefficient). 60% SCHD + 40% JEPI blended: ~$25,200/year. SCHD and VYM together hold $189+ billion in assets — two of the largest dividend ETFs in existence (247wallst August 2026). Sources: 247wallst August 2026; dividend.watch June 2026; heygotrade Q2 2026. Not financial advice. Data changes daily.
In dividend ETF investing, the barbell applies the same logic to two dimensions: yield and growth. On one end: high-yield ETFs that pay generously right now. On the other end: dividend growth ETFs that pay modestly now but grow their payouts consistently year after year. The middle — ETFs that offer mediocre yield and mediocre growth — is exactly what the barbell explicitly avoids.
Kiplinger’s definitive article on the strategy describes the two roles directly: ‘If the high-yield side of the barbell is responsible for generating the current income needed to support retirement withdrawals, the dividend growth side is responsible for growing the portfolio’s long-term earning power.’ The strategy’s power lies in the complementarity: what the high-yield side lacks (growth) is exactly what the growth side provides, and what the growth side lacks (immediate income) is exactly what the high-yield side provides. Not financial advice.
Rather than viewing these ETFs as competing strategies, investors can combine them in a dividend barbell portfolio. If the high-yield side of the barbell is responsible for generating the current income needed to support retirement withdrawals, the dividend growth side is responsible for growing the portfolio's long-term earning power.' This is the cleanest summary of why the strategy exists. Not financial advice.
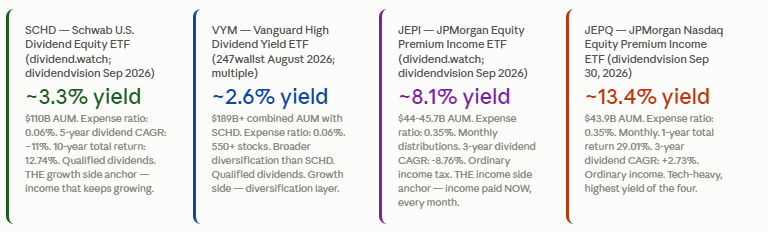
The two ETFs most consistently recommended for this side of the barbell are SCHD (Schwab U.S. Dividend Equity ETF) and VYM (Vanguard High Dividend Yield ETF). They are the two largest dividend-focused ETFs in the world, collectively holding over $189 billion in assets as of August 2026 (247 Wall St). They share a structural characteristic: both pay qualified dividends, which means the distributions are taxed at the lower long-term capital gains rate rather than your ordinary income rate — a meaningful tax advantage that the income side of the barbell does not have. Not financial advice.
The yield alone — approximately 3.06–3.44% depending on the date — does not look impressive next to JEPI’s 8%. But the yield-on-cost story changes the picture. If SCHD’s dividend has grown at approximately 11% annually over the past five years (moneynestlab, February 2026), a 3.5% yield today becomes effectively 6-7% on cost in ten years for a long-term holder. The investor who bought SCHD five years ago is not collecting 3.5% on their original investment — they are collecting significantly more, and it keeps growing. As moneynestlab puts it: ‘SCHD is the wealth-building machine.’
The caution is real: SCHD’s distributions shrank in some periods from 2024 to 2026 (247 Wall St July 2026). The 14-year track record of dividend growth is impressive but does not guarantee the next 14 years. Dividend growth in 2026 has stalled in some analyses (Pluang July 2026). These are legitimate risks. SCHD is the growth engine of the barbell, not an income guarantee. Not financial advice.
SCHD data (September-October 2026): AUM: $110 billion. Yield: ~3.06-3.44%. Expense ratio: 0.06%. Dividend frequency: Quarterly. Dividend CAGR 3-year: 6.25%. Dividend CAGR 5-year: ~11%. Total return 1-year: 27.71%. Total return 10-year: 12.74%. Beta: 0.61. Payout ratio: ~53-62% (sustainable). Index: Dow Jones U.S. Dividend 100. Tax: qualified dividends. $300K in SCHD = ~$9,180/year at current yield (247wallst August 2026). Sources: dividend.watch June 2026; dividendvision September 2026; 247wallst August 2026; moneynestlab February 2026. Not financial advice.
The 247 Wall St analysis of August 2026 summarises how experienced retirees combine the two: ‘Many retirees pair them, using SCHD as the income-generating anchor and VYM as the broader diversification layer, capturing both quality discipline and broad market coverage in a single dividend-focused equity allocation.’ The pairing makes sense: SCHD provides quality concentration and dividend growth discipline; VYM provides exposure to a wider swath of the dividend-paying market that SCHD’s strict screens might exclude.
The lower yield is a real limitation for retirees who need current income. VYM at 2.4–2.9% on a $300,000 allocation produces approximately $6,570–8,700 per year — useful as part of a strategy, but not a standalone income solution. VYM’s value in the barbell is diversification breadth and the qualified dividend tax treatment — it keeps the growth side of the barbell tax-efficient while expanding beyond SCHD’s concentrated 100-stock universe. Not financial advice.
This covered-call strategy is what produces the eye-catching yields — 7.93–8.27% for JEPI and 10.27–13.37% for JEPQ as of September-October 2026. The trade-off is explicit: selling covered calls caps the ETF’s upside participation in strong bull markets. When the S&P 500 rips 30% in a year, JEPI and JEPQ will lag significantly (247 Wall St July 2026). The options premium is the income; the capped upside is the cost.
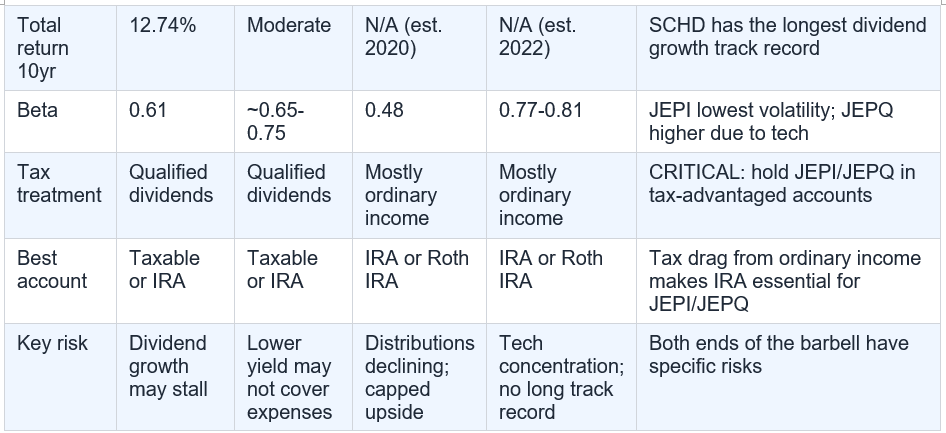
The other trade-off is tax treatment. Unlike SCHD and VYM, whose distributions are classified as qualified dividends, JEPI and JEPQ’s distributions are largely classified as ordinary income. That means they are taxed at your marginal income tax rate rather than the lower capital gains rate. This distinction is significant enough that multiple sources — 247wallst, pluang, heygotrade, moneynestlab — all recommend holding JEPI and JEPQ inside tax-advantaged accounts (traditional IRA or Roth IRA) rather than in a taxable brokerage. Not financial advice.
The monthly distribution is the headline feature. Unlike SCHD and VYM, which pay quarterly, JEPI deposits income into your account every month. For retirees managing a monthly budget, this is a material practical advantage. At a current yield of approximately 7.93–8.27%, JEPI produces roughly $660–$690 per month on a $100,000 position — or approximately $3,970–4,135 per month on a $500,000 position.
The critical caveat: JEPI’s 3-year dividend CAGR is –8.76% (dividend.watch, June 2026). The distributions are declining. Pluang’s September 2026 analysis confirms: ‘SCHD and JEPI ETFs offer different retirement income strategies; SCHD suits growth, JEPI suits high monthly payouts.’ The high monthly payout is exactly what JEPI is for — it is not the vehicle for growing your income over time. That’s why it needs the other end of the barbell. Not financial advice.
JEPI limitations for retirement: (1) Distributions are primarily ordinary income, not qualified dividends — taxed at marginal rates. Hold in IRA/Roth IRA, not taxable accounts. (2) Dividend CAGR is -8.76% over 3 years (dividend.watch June 2026) — the payouts have been shrinking, not growing. (3) Covered call strategy caps upside in bull markets — if S&P 500 rises 30%, JEPI may rise only 10-15%. (4) Short track record — launched May 2020, no data through a full cycle. (5) Higher expense ratio: 0.35% vs 0.06% for SCHD/VYM. Source: 247wallst July 2026; dividend.watch June 2026; pluang September 2026. Not financial advice.
The performance numbers are striking: JEPQ’s 1-year total return of 29.01% and 3-year total return of 20.93% (dividend.watch, June 2026) significantly exceed JEPI’s 7.78% and 8.84% over the same periods. JEPQ’s 3-year dividend CAGR of +2.73% is also meaningfully better than JEPI’s –8.76%. In both total return and distribution growth, JEPQ has performed better than JEPI in recent years — with the expected caveat that past performance does not guarantee future results, and that JEPQ’s technology concentration introduces sector-specific risk.
The tax treatment is the same as JEPI: ordinary income, not qualified dividends. The recommendation is identical: hold inside a tax-advantaged account. With an expense ratio of 0.35% (same as JEPI), and $43.9 billion in AUM as of September 2026, JEPQ has established itself as a credible high-yield income position for the income end of the dividend barbell. Not financial advice.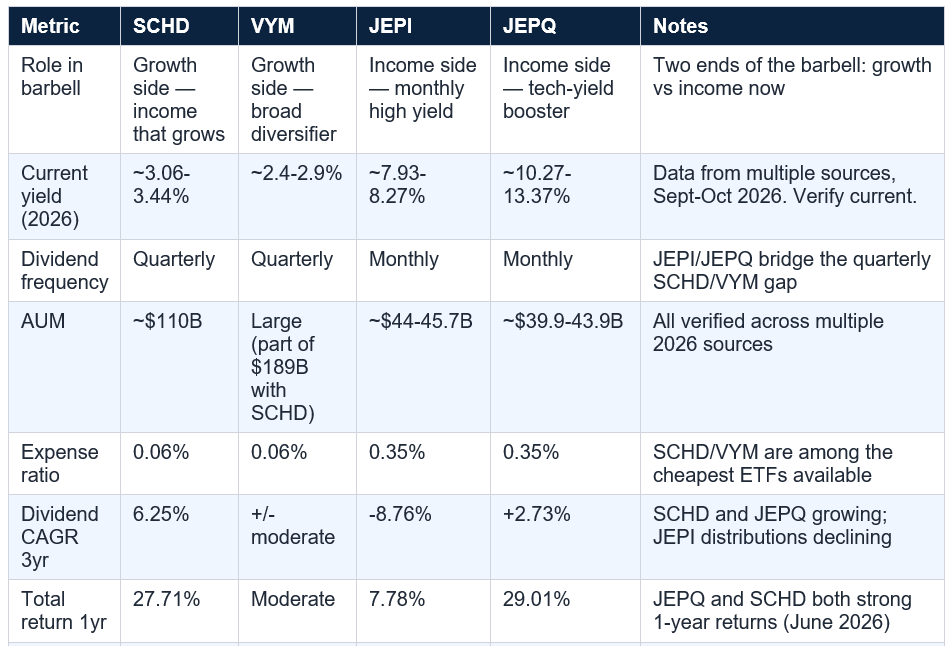
SCHD and VYM pay qualified dividends — distributions that meet the IRS holding period requirements and are taxed at the lower long-term capital gains rates: 0% for those in the 10–12% income bracket, 15% for most middle-income filers, and 20% for high earners. These rates are substantially lower than ordinary income tax rates, which top out at 37%. SCHD and VYM can be held in taxable brokerage accounts without punishing tax drag.
JEPI and JEPQ are different. Their income comes primarily from options premiums, which are classified as ordinary income by the IRS, taxed at your marginal rate. Holding $300,000 of JEPI in a taxable account and receiving $24,000 per year in ordinary income adds $24,000 to your taxable income. For a retiree in the 22% bracket, that is $5,280 in federal tax per year that would be $0 in a Roth IRA and deferred in a traditional IRA. Multiple 2026 sources — 247wallst, heygotrade, moneynestlab, pluang — all make the same recommendation explicitly: hold JEPI and JEPQ in tax-advantaged accounts. Not tax advice. Consult a CPA.
The tax placement rule for the dividend barbell: SCHD + VYM (qualified dividends, 0-20% tax rate) → can be held in taxable account. JEPI + JEPQ (mostly ordinary income, taxed at marginal rate) → hold in traditional IRA or Roth IRA. In a Roth IRA: JEPI/JEPQ distributions grow and are eventually withdrawn completely tax-free. In a traditional IRA: distributions are tax-deferred until withdrawal. In a taxable account: JEPI/JEPQ distributions are taxed every year at ordinary income rates, significantly eroding the effective yield. Sources: 247wallst August 2026; heygotrade Q2 2026; moneynestlab February 2026; pluang September 2026. Not tax advice. Consult a CPA.
SCHD’s distributions also face risks. The 14-year track record is genuinely impressive, but dividend growth stalled in some recent analyses (Pluang July 2026). The Dow Jones U.S. Dividend 100 index screens for quality, but it cannot screen for macroeconomic shocks, sector-wide dividend cuts, or long bear markets in which even high-quality dividend payers reduce payouts to preserve cash.
The barbell also does not solve sequence of returns risk on its own. If markets drop 40% in the first two years of retirement, both the growth side and the income side of the barbell lose principal value, and the yield percentage stays roughly constant but the dollar amount drops. A retiree living purely off dividend income from a barbell portfolio will see that income compressed in a deep bear market. The solution is what it always is: maintain a cash reserve of one to two years of living expenses outside the barbell, so you do not have to draw from depressed assets. Not financial advice.
The numbers from 2026 bear out the complementarity. SCHD’s 27% one-year total return and 10-year total return of 12.74% demonstrate its wealth-compounding capability. JEPQ’s 29.01% one-year total return and 13.37% yield deliver both current income and growth. JEPI’s 8.27% monthly yield fills the income gap month by month. VYM’s $189 billion combined AUM with SCHD reflects the institutional confidence in broad dividend-quality investing. Together, the barbell covers the spread.
The allocation between the two ends depends on where you are in retirement, what your other income sources cover, and where your assets sit from a tax perspective. But the framework itself is clear. Kiplinger put it simply: the high-yield side generates current income; the dividend growth side grows the long-term earning power. Both ends of the barbell are necessary. Neither end works as well alone. Not financial, investment, or tax advice. Verify all ETF data with current sources before investing. Consult a fee-only CFP and CPA for guidance specific to your retirement situation.
The dividend barbell is a retirement income strategy that combines two opposing types of dividend ETFs to address both immediate income needs and long-term income growth simultaneously. On one end are high-yield ETFs — primarily JEPI and JEPQ — which generate generous current income (7-13%+ yields in 2026) paid monthly, primarily through covered-call strategies. On the other end are dividend growth ETFs — primarily SCHD and VYM — which offer lower current yields (3-3.5%) but grow their distributions at 10-11% per year, providing income that expands with inflation over time. Kiplinger describes the logic directly: 'If the high-yield side of the barbell is responsible for generating the current income needed to support retirement withdrawals, the dividend growth side is responsible for growing the portfolio's long-term earning power.' The barbell avoids the mediocre middle — ETFs that deliver neither impressive current yield nor impressive growth. Not financial advice.
How much income can you generate from a dividend barbell portfolio?
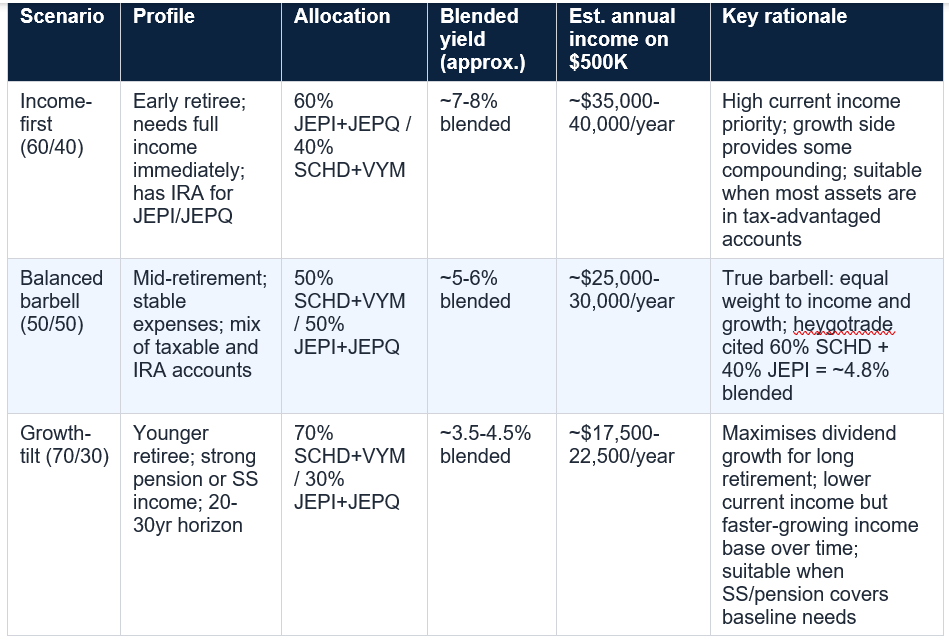
It depends on the allocation and portfolio size. Using a 60% SCHD + 40% JEPI blend — cited by heygotrade (Q2 2026) as producing approximately 4.8% blended yield: on $500,000 = approximately $24,000 per year ($2,000/month). On $1 million = approximately $48,000 per year. A more income-weighted barbell (60% JEPI/JEPQ, 40% SCHD/VYM) on $500,000 might produce $35,000-$40,000 per year. 247 Wall St (August 2026) calculated specific allocations: $300,000 in SCHD = approximately $9,180/year; $300,000 in VYM = approximately $6,570/year; $300,000 in JEPI at ~8% = approximately $24,000/year. On $10,000: JEPQ generates approximately $111.42 per distribution, JEPI approximately $66.08, SCHD approximately $82.00 (dividendvision, September 2026). All figures from published sources; actual results will vary. Not financial advice. Data changes daily.
Should I hold JEPI and JEPQ in an IRA or a taxable account?
In a tax-advantaged account (traditional IRA or Roth IRA), not a taxable account. JEPI and JEPQ's distributions are primarily classified as ordinary income by the IRS because they come from options premiums rather than qualified dividends. In a taxable account, these distributions are taxed at your marginal income tax rate — potentially 22-37% for many retirees. In a Roth IRA, the distributions grow and are eventually withdrawn completely tax-free. In a traditional IRA, they are tax-deferred until withdrawal. By contrast, SCHD and VYM pay qualified dividends taxed at the lower capital gains rates (0%, 15%, or 20%) and can be held efficiently in taxable accounts. The tax placement rule that multiple 2026 sources recommend: SCHD/VYM → taxable or IRA; JEPI/JEPQ → IRA or Roth IRA. Sources: 247wallst August 2026; heygotrade Q2 2026; moneynestlab February 2026; pluang September 2026. Not tax advice. Consult a CPA.
What is the difference between JEPI and JEPQ?
Both are JPMorgan covered-call equity income ETFs that generate income from two sources: dividends from their stock holdings and premiums from selling covered call options. The key difference is the underlying equity exposure. JEPI holds large-cap S&P 500 stocks — broad market exposure. JEPQ holds Nasdaq-100 stocks — technology-heavy exposure. Because technology stocks are more volatile, JEPQ generates higher options premiums, producing a higher yield (10.27-13.37% for JEPQ vs 7.93-8.27% for JEPI as of September-October 2026). The 2026 performance data shows JEPQ also delivered better total returns: 1-year 29.01% vs JEPI 7.78%; 3-year 20.93% vs JEPI 8.84%. JEPQ's 3-year dividend CAGR (+2.73%) is also better than JEPI's (-8.76%). However, JEPQ has higher technology concentration risk and a shorter track record. Both use ordinary income tax treatment. Sources: dividend.watch June 2026; dividendvision September 2026; 247wallst July 2026. Not financial advice.
Is the dividend barbell better than just holding SCHD alone?
For retirees who need income that covers actual monthly expenses, a dividend barbell typically makes more practical sense than SCHD alone in the early years of retirement. SCHD at 3.06-3.44% yield on a $500,000 portfolio produces approximately $15,300-17,200 per year — $1,275-1,433 per month. For many retirees, this does not cover monthly expenses, which means the 'income investing' approach without the high-yield component forces principal drawdown anyway, defeating part of the purpose. Adding JEPI or JEPQ to the other end of the barbell raises the blended yield to 4.8-7%+ (depending on allocation), providing the income floor that SCHD alone cannot. The trade-off: SCHD alone gives you the cleanest dividend growth story and the best tax efficiency in a taxable account. The barbell adds income but introduces the tax complexity of JEPI/JEPQ's ordinary income treatment. For investors who have the tax-advantaged account space to hold JEPI/JEPQ properly, the barbell outperforms SCHD alone in retirement income terms. Sources: heygotrade Q2 2026; 247wallst August 2026; dividend.watch June 2026. Not financial advice.
Table of Contents
- The Retirement Income Problem the Barbell Was Built to Solve
- What Is the Dividend Barbell? The Core Concept
- The Growth Side of the Barbell: SCHD and VYM
- Deep Dive: SCHD — The Dividend Growth Backbone
- Deep Dive: VYM — The Broad Income Diversifier
- The Income Side of the Barbell: JEPI and JEPQ
- Deep Dive: JEPI — The Monthly High-Yield Engine
- Deep Dive: JEPQ — The Tech-Yield Booster
- The Complete ETF Comparison: All Four Side by Side
- How to Allocate the Barbell: Three Portfolio Scenarios
- The Tax Rules That Change Everything
- What the Barbell Won’t Do (The Honest Limitations)
- Conclusion: Both Ends of the Barbell Are Necessary
- Frequently Asked Questions
- External References and Further Reading
The Retirement Income Problem the Barbell Was Built to Solve
Walk into retirement with a simple dividend income strategy and you face a choice that feels like it shouldn’t exist. You can chase high yield — an ETF that throws off 8% in distributions every year, paid monthly, reliable and generous. The problem: that high yield often comes from a covered-call strategy that caps the ETF’s upside in strong markets and whose distributions have been declining in real terms. In ten years, you may be collecting 8% of a portfolio that hasn’t grown much, while the cost of living has climbed steadily above what that income covers.Or you can choose the dividend growth path — an ETF with a 3% yield today that grows its distributions at 10-11% per year. Patient, compounding, inflation-beating. The problem: a 3% yield on a $500,000 portfolio is $15,000 per year. That is $1,250 per month. For many retirees, that does not cover basic expenses without drawing down the principal, which is exactly what you were trying to avoid.
The barbell does not choose between these two paths. It runs both simultaneously. The high-yield side covers your income needs right now. The dividend growth side builds the earning power that will cover your income needs in fifteen years. As 247 Wall St described it in July 2026: the four ETFs in a barbell portfolio provide ‘monthly cash flow, growing income, and total return growth’ — covering all three things a retirement portfolio actually needs. Not financial advice.
The retirement income tension in numbers (2026): SCHD yield: ~3.06-3.44% (quarterly; dividend growth ~11%/year 5-year average). JEPI yield: ~7.93-8.27% (monthly; distribution CAGR -8.76% over 3 years — declining). On $500K: SCHD alone = ~$16,500/year. JEPI alone = ~$40,000/year (but growth-limited and tax-inefficient). 60% SCHD + 40% JEPI blended: ~$25,200/year. SCHD and VYM together hold $189+ billion in assets — two of the largest dividend ETFs in existence (247wallst August 2026). Sources: 247wallst August 2026; dividend.watch June 2026; heygotrade Q2 2026. Not financial advice. Data changes daily.
What Is the Dividend Barbell? The Core Concept
The barbell is a structural metaphor borrowed from bond investing. In fixed income, a barbell portfolio holds assets at two extremes — very short duration and very long duration — and avoids the middle. The logic is that the two ends serve different purposes and that blending them produces better risk-adjusted outcomes than concentrating in the mediocre middle.In dividend ETF investing, the barbell applies the same logic to two dimensions: yield and growth. On one end: high-yield ETFs that pay generously right now. On the other end: dividend growth ETFs that pay modestly now but grow their payouts consistently year after year. The middle — ETFs that offer mediocre yield and mediocre growth — is exactly what the barbell explicitly avoids.
Kiplinger’s definitive article on the strategy describes the two roles directly: ‘If the high-yield side of the barbell is responsible for generating the current income needed to support retirement withdrawals, the dividend growth side is responsible for growing the portfolio’s long-term earning power.’ The strategy’s power lies in the complementarity: what the high-yield side lacks (growth) is exactly what the growth side provides, and what the growth side lacks (immediate income) is exactly what the high-yield side provides. Not financial advice.
Rather than viewing these ETFs as competing strategies, investors can combine them in a dividend barbell portfolio. If the high-yield side of the barbell is responsible for generating the current income needed to support retirement withdrawals, the dividend growth side is responsible for growing the portfolio's long-term earning power.' This is the cleanest summary of why the strategy exists. Not financial advice.
The Growth Side of the Barbell: SCHD and VYM
The growth end of the dividend barbell is built for what comes after the first few years of retirement. The ETFs here pay a yield that probably won’t cover all your monthly expenses on its own — but their distributions grow every year, their underlying holdings are financially strong companies with durable business models, and their long-term total return competes with the broader market in ways that high-yield covered-call ETFs cannot.The two ETFs most consistently recommended for this side of the barbell are SCHD (Schwab U.S. Dividend Equity ETF) and VYM (Vanguard High Dividend Yield ETF). They are the two largest dividend-focused ETFs in the world, collectively holding over $189 billion in assets as of August 2026 (247 Wall St). They share a structural characteristic: both pay qualified dividends, which means the distributions are taxed at the lower long-term capital gains rate rather than your ordinary income rate — a meaningful tax advantage that the income side of the barbell does not have. Not financial advice.
Deep Dive: SCHD — The Dividend Growth Backbone
SCHD tracks the Dow Jones U.S. Dividend 100 Index — 100 stocks that have paid dividends for at least ten consecutive years and that pass a financial health screen for relative dividend yield, cash flow to debt, return on equity, and dividend yield. The result is a concentrated portfolio of quality companies with a proven track record of dividend growth and the financial muscle to continue it. With $110 billion in AUM as of September 2026, it is the largest dividend ETF in the world.The yield alone — approximately 3.06–3.44% depending on the date — does not look impressive next to JEPI’s 8%. But the yield-on-cost story changes the picture. If SCHD’s dividend has grown at approximately 11% annually over the past five years (moneynestlab, February 2026), a 3.5% yield today becomes effectively 6-7% on cost in ten years for a long-term holder. The investor who bought SCHD five years ago is not collecting 3.5% on their original investment — they are collecting significantly more, and it keeps growing. As moneynestlab puts it: ‘SCHD is the wealth-building machine.’
The caution is real: SCHD’s distributions shrank in some periods from 2024 to 2026 (247 Wall St July 2026). The 14-year track record of dividend growth is impressive but does not guarantee the next 14 years. Dividend growth in 2026 has stalled in some analyses (Pluang July 2026). These are legitimate risks. SCHD is the growth engine of the barbell, not an income guarantee. Not financial advice.
SCHD data (September-October 2026): AUM: $110 billion. Yield: ~3.06-3.44%. Expense ratio: 0.06%. Dividend frequency: Quarterly. Dividend CAGR 3-year: 6.25%. Dividend CAGR 5-year: ~11%. Total return 1-year: 27.71%. Total return 10-year: 12.74%. Beta: 0.61. Payout ratio: ~53-62% (sustainable). Index: Dow Jones U.S. Dividend 100. Tax: qualified dividends. $300K in SCHD = ~$9,180/year at current yield (247wallst August 2026). Sources: dividend.watch June 2026; dividendvision September 2026; 247wallst August 2026; moneynestlab February 2026. Not financial advice.
Deep Dive: VYM — The Broad Income Diversifier
VYM tracks the FTSE High Dividend Yield Index — a broader, less filtered approach than SCHD. Where SCHD concentrates in 100 financially disciplined companies, VYM holds 550+ dividend-paying US stocks across financials, energy, healthcare, and utilities. The yield is slightly lower (approximately 2.4–2.9% depending on the source and date), but the diversification is significantly wider.The 247 Wall St analysis of August 2026 summarises how experienced retirees combine the two: ‘Many retirees pair them, using SCHD as the income-generating anchor and VYM as the broader diversification layer, capturing both quality discipline and broad market coverage in a single dividend-focused equity allocation.’ The pairing makes sense: SCHD provides quality concentration and dividend growth discipline; VYM provides exposure to a wider swath of the dividend-paying market that SCHD’s strict screens might exclude.
The lower yield is a real limitation for retirees who need current income. VYM at 2.4–2.9% on a $300,000 allocation produces approximately $6,570–8,700 per year — useful as part of a strategy, but not a standalone income solution. VYM’s value in the barbell is diversification breadth and the qualified dividend tax treatment — it keeps the growth side of the barbell tax-efficient while expanding beyond SCHD’s concentrated 100-stock universe. Not financial advice.
The Income Side of the Barbell: JEPI and JEPQ
The income end of the dividend barbell has a fundamentally different engine than the growth side. While SCHD and VYM generate income from the dividends paid by their underlying stocks, JEPI and JEPQ generate income from two sources simultaneously: dividends from their stock holdings and premiums from selling covered call options on those holdings.This covered-call strategy is what produces the eye-catching yields — 7.93–8.27% for JEPI and 10.27–13.37% for JEPQ as of September-October 2026. The trade-off is explicit: selling covered calls caps the ETF’s upside participation in strong bull markets. When the S&P 500 rips 30% in a year, JEPI and JEPQ will lag significantly (247 Wall St July 2026). The options premium is the income; the capped upside is the cost.
The other trade-off is tax treatment. Unlike SCHD and VYM, whose distributions are classified as qualified dividends, JEPI and JEPQ’s distributions are largely classified as ordinary income. That means they are taxed at your marginal income tax rate rather than the lower capital gains rate. This distinction is significant enough that multiple sources — 247wallst, pluang, heygotrade, moneynestlab — all recommend holding JEPI and JEPQ inside tax-advantaged accounts (traditional IRA or Roth IRA) rather than in a taxable brokerage. Not financial advice.
Deep Dive: JEPI — The Monthly High-Yield Engine
JEPI launched in May 2020 — which means it does not yet have a full 10-year track record through a complete market cycle. What it does have is five years of demonstrated monthly income delivery, an $44–45 billion AUM base that reflects enormous institutional and retail adoption, and the lowest volatility profile of the four ETFs discussed here (beta 0.48 as of June 2026).The monthly distribution is the headline feature. Unlike SCHD and VYM, which pay quarterly, JEPI deposits income into your account every month. For retirees managing a monthly budget, this is a material practical advantage. At a current yield of approximately 7.93–8.27%, JEPI produces roughly $660–$690 per month on a $100,000 position — or approximately $3,970–4,135 per month on a $500,000 position.
The critical caveat: JEPI’s 3-year dividend CAGR is –8.76% (dividend.watch, June 2026). The distributions are declining. Pluang’s September 2026 analysis confirms: ‘SCHD and JEPI ETFs offer different retirement income strategies; SCHD suits growth, JEPI suits high monthly payouts.’ The high monthly payout is exactly what JEPI is for — it is not the vehicle for growing your income over time. That’s why it needs the other end of the barbell. Not financial advice.
JEPI limitations for retirement: (1) Distributions are primarily ordinary income, not qualified dividends — taxed at marginal rates. Hold in IRA/Roth IRA, not taxable accounts. (2) Dividend CAGR is -8.76% over 3 years (dividend.watch June 2026) — the payouts have been shrinking, not growing. (3) Covered call strategy caps upside in bull markets — if S&P 500 rises 30%, JEPI may rise only 10-15%. (4) Short track record — launched May 2020, no data through a full cycle. (5) Higher expense ratio: 0.35% vs 0.06% for SCHD/VYM. Source: 247wallst July 2026; dividend.watch June 2026; pluang September 2026. Not financial advice.
Deep Dive: JEPQ — The Tech-Yield Booster
JEPQ does everything JEPI does but applies the covered-call strategy to the Nasdaq-100 rather than the S&P 500. The higher underlying volatility of technology stocks produces more valuable options premiums — which is why JEPQ’s yield sits at 10.27–13.37%, well above JEPI’s 7.93%. If JEPI is the monthly workhorse, JEPQ is the amplified version for investors who want maximum current distribution income and are comfortable with technology sector concentration.The performance numbers are striking: JEPQ’s 1-year total return of 29.01% and 3-year total return of 20.93% (dividend.watch, June 2026) significantly exceed JEPI’s 7.78% and 8.84% over the same periods. JEPQ’s 3-year dividend CAGR of +2.73% is also meaningfully better than JEPI’s –8.76%. In both total return and distribution growth, JEPQ has performed better than JEPI in recent years — with the expected caveat that past performance does not guarantee future results, and that JEPQ’s technology concentration introduces sector-specific risk.
The tax treatment is the same as JEPI: ordinary income, not qualified dividends. The recommendation is identical: hold inside a tax-advantaged account. With an expense ratio of 0.35% (same as JEPI), and $43.9 billion in AUM as of September 2026, JEPQ has established itself as a credible high-yield income position for the income end of the dividend barbell. Not financial advice.
The Complete ETF Comparison: All Four Side by Side
How to Allocate the Barbell: Three Portfolio Scenarios
The ratio between the two ends of the barbell — growth vs income — depends on three things: how much income you need right now, how long your retirement is expected to last, and your tax situation. The following three scenarios are illustrative frameworks, not personalised advice. Not financial advice.
The Tax Rules That Change Everything
The dividend barbell’s most important practical rule is about which side of the barbell goes in which type of account. Get this wrong and you may pay significantly more in taxes than necessary, which directly reduces the effective yield of the strategy.SCHD and VYM pay qualified dividends — distributions that meet the IRS holding period requirements and are taxed at the lower long-term capital gains rates: 0% for those in the 10–12% income bracket, 15% for most middle-income filers, and 20% for high earners. These rates are substantially lower than ordinary income tax rates, which top out at 37%. SCHD and VYM can be held in taxable brokerage accounts without punishing tax drag.
JEPI and JEPQ are different. Their income comes primarily from options premiums, which are classified as ordinary income by the IRS, taxed at your marginal rate. Holding $300,000 of JEPI in a taxable account and receiving $24,000 per year in ordinary income adds $24,000 to your taxable income. For a retiree in the 22% bracket, that is $5,280 in federal tax per year that would be $0 in a Roth IRA and deferred in a traditional IRA. Multiple 2026 sources — 247wallst, heygotrade, moneynestlab, pluang — all make the same recommendation explicitly: hold JEPI and JEPQ in tax-advantaged accounts. Not tax advice. Consult a CPA.
The tax placement rule for the dividend barbell: SCHD + VYM (qualified dividends, 0-20% tax rate) → can be held in taxable account. JEPI + JEPQ (mostly ordinary income, taxed at marginal rate) → hold in traditional IRA or Roth IRA. In a Roth IRA: JEPI/JEPQ distributions grow and are eventually withdrawn completely tax-free. In a traditional IRA: distributions are tax-deferred until withdrawal. In a taxable account: JEPI/JEPQ distributions are taxed every year at ordinary income rates, significantly eroding the effective yield. Sources: 247wallst August 2026; heygotrade Q2 2026; moneynestlab February 2026; pluang September 2026. Not tax advice. Consult a CPA.
What the Barbell Won’t Do (The Honest Limitations)
The dividend barbell is a powerful retirement income framework. It is not a guarantee of anything. JEPI’s 3-year dividend CAGR of –8.76% is a real warning: the income from the high-yield side has been declining, not growing, over the recent period. If the decline continues at that rate for another five years, JEPI’s real income contribution to the barbell will be meaningfully lower than it appears today. The monthly payment is not a pension.SCHD’s distributions also face risks. The 14-year track record is genuinely impressive, but dividend growth stalled in some recent analyses (Pluang July 2026). The Dow Jones U.S. Dividend 100 index screens for quality, but it cannot screen for macroeconomic shocks, sector-wide dividend cuts, or long bear markets in which even high-quality dividend payers reduce payouts to preserve cash.
The barbell also does not solve sequence of returns risk on its own. If markets drop 40% in the first two years of retirement, both the growth side and the income side of the barbell lose principal value, and the yield percentage stays roughly constant but the dollar amount drops. A retiree living purely off dividend income from a barbell portfolio will see that income compressed in a deep bear market. The solution is what it always is: maintain a cash reserve of one to two years of living expenses outside the barbell, so you do not have to draw from depressed assets. Not financial advice.
Conclusion
The dividend barbell is the most sensible framework for retirement ETF income investing because it mirrors the actual structure of the problem. Retirement income is not a single problem — it is two problems at once. Today’s bills need today’s income. Tomorrow’s bills, inflated by another decade of cost increases, need income that has grown to match them. JEPI and JEPQ solve the first problem. SCHD and VYM solve the second.The numbers from 2026 bear out the complementarity. SCHD’s 27% one-year total return and 10-year total return of 12.74% demonstrate its wealth-compounding capability. JEPQ’s 29.01% one-year total return and 13.37% yield deliver both current income and growth. JEPI’s 8.27% monthly yield fills the income gap month by month. VYM’s $189 billion combined AUM with SCHD reflects the institutional confidence in broad dividend-quality investing. Together, the barbell covers the spread.
The allocation between the two ends depends on where you are in retirement, what your other income sources cover, and where your assets sit from a tax perspective. But the framework itself is clear. Kiplinger put it simply: the high-yield side generates current income; the dividend growth side grows the long-term earning power. Both ends of the barbell are necessary. Neither end works as well alone. Not financial, investment, or tax advice. Verify all ETF data with current sources before investing. Consult a fee-only CFP and CPA for guidance specific to your retirement situation.
Frequently Asked Questions
What is the dividend barbell strategy for retirement?The dividend barbell is a retirement income strategy that combines two opposing types of dividend ETFs to address both immediate income needs and long-term income growth simultaneously. On one end are high-yield ETFs — primarily JEPI and JEPQ — which generate generous current income (7-13%+ yields in 2026) paid monthly, primarily through covered-call strategies. On the other end are dividend growth ETFs — primarily SCHD and VYM — which offer lower current yields (3-3.5%) but grow their distributions at 10-11% per year, providing income that expands with inflation over time. Kiplinger describes the logic directly: 'If the high-yield side of the barbell is responsible for generating the current income needed to support retirement withdrawals, the dividend growth side is responsible for growing the portfolio's long-term earning power.' The barbell avoids the mediocre middle — ETFs that deliver neither impressive current yield nor impressive growth. Not financial advice.
How much income can you generate from a dividend barbell portfolio?
It depends on the allocation and portfolio size. Using a 60% SCHD + 40% JEPI blend — cited by heygotrade (Q2 2026) as producing approximately 4.8% blended yield: on $500,000 = approximately $24,000 per year ($2,000/month). On $1 million = approximately $48,000 per year. A more income-weighted barbell (60% JEPI/JEPQ, 40% SCHD/VYM) on $500,000 might produce $35,000-$40,000 per year. 247 Wall St (August 2026) calculated specific allocations: $300,000 in SCHD = approximately $9,180/year; $300,000 in VYM = approximately $6,570/year; $300,000 in JEPI at ~8% = approximately $24,000/year. On $10,000: JEPQ generates approximately $111.42 per distribution, JEPI approximately $66.08, SCHD approximately $82.00 (dividendvision, September 2026). All figures from published sources; actual results will vary. Not financial advice. Data changes daily.
Should I hold JEPI and JEPQ in an IRA or a taxable account?
In a tax-advantaged account (traditional IRA or Roth IRA), not a taxable account. JEPI and JEPQ's distributions are primarily classified as ordinary income by the IRS because they come from options premiums rather than qualified dividends. In a taxable account, these distributions are taxed at your marginal income tax rate — potentially 22-37% for many retirees. In a Roth IRA, the distributions grow and are eventually withdrawn completely tax-free. In a traditional IRA, they are tax-deferred until withdrawal. By contrast, SCHD and VYM pay qualified dividends taxed at the lower capital gains rates (0%, 15%, or 20%) and can be held efficiently in taxable accounts. The tax placement rule that multiple 2026 sources recommend: SCHD/VYM → taxable or IRA; JEPI/JEPQ → IRA or Roth IRA. Sources: 247wallst August 2026; heygotrade Q2 2026; moneynestlab February 2026; pluang September 2026. Not tax advice. Consult a CPA.
What is the difference between JEPI and JEPQ?
Both are JPMorgan covered-call equity income ETFs that generate income from two sources: dividends from their stock holdings and premiums from selling covered call options. The key difference is the underlying equity exposure. JEPI holds large-cap S&P 500 stocks — broad market exposure. JEPQ holds Nasdaq-100 stocks — technology-heavy exposure. Because technology stocks are more volatile, JEPQ generates higher options premiums, producing a higher yield (10.27-13.37% for JEPQ vs 7.93-8.27% for JEPI as of September-October 2026). The 2026 performance data shows JEPQ also delivered better total returns: 1-year 29.01% vs JEPI 7.78%; 3-year 20.93% vs JEPI 8.84%. JEPQ's 3-year dividend CAGR (+2.73%) is also better than JEPI's (-8.76%). However, JEPQ has higher technology concentration risk and a shorter track record. Both use ordinary income tax treatment. Sources: dividend.watch June 2026; dividendvision September 2026; 247wallst July 2026. Not financial advice.
Is the dividend barbell better than just holding SCHD alone?
For retirees who need income that covers actual monthly expenses, a dividend barbell typically makes more practical sense than SCHD alone in the early years of retirement. SCHD at 3.06-3.44% yield on a $500,000 portfolio produces approximately $15,300-17,200 per year — $1,275-1,433 per month. For many retirees, this does not cover monthly expenses, which means the 'income investing' approach without the high-yield component forces principal drawdown anyway, defeating part of the purpose. Adding JEPI or JEPQ to the other end of the barbell raises the blended yield to 4.8-7%+ (depending on allocation), providing the income floor that SCHD alone cannot. The trade-off: SCHD alone gives you the cleanest dividend growth story and the best tax efficiency in a taxable account. The barbell adds income but introduces the tax complexity of JEPI/JEPQ's ordinary income treatment. For investors who have the tax-advantaged account space to hold JEPI/JEPQ properly, the barbell outperforms SCHD alone in retirement income terms. Sources: heygotrade Q2 2026; 247wallst August 2026; dividend.watch June 2026. Not financial advice.
0 Comments
Be the first to share your thoughts on this article.