

Investing
S&P 500 Valuation Hits a Level Seen Only Twice in 155 Years?

The S&P 500 is extending its three-year gain. Here is what the rare signal means, and what it cannot tell you.Shiller P/E above 40 (41.72 end of June 2026) vs long-run average about 17.4; S&P 500 up 78% over three calendar years and about 11% in 2026 through 12 Nov; peak of 44.19 in November 1999 before drops of 37% to 49%.
The headline makes it sound like a stopwatch is running. The reality is more modest, and more interesting. The "something" is a valuation reading: the S&P 500's Shiller P/E ratio has moved above 40, a level that has happened only once before, in the dot-com bubble. At the same time, the index has climbed 78% over the past three calendar years, and was up nearly 11% in 2026 through 12 November. That is the "three-year gain" the headline mentions, and it is why valuations are so high.
Is history "crystal clear"? Not really. The article itself rests on only two episodes of a CAPE above 40, which is a very small sample, and it provides no return data to support an expected decline. What history does show is that very high valuations have usually been followed by weaker long-run returns, but with a huge uncertainty on timing. In 1999 the signal was early by years.
Key takeaway: A CAPE above 40 is a real warning about future returns, not a timer. It says the market is expensive, not that a crash is due next month. It is a reason to check your risk, not a reason to panic.
The counting varies by article. The July piece says the CAPE has technically exceeded 40 three times over 155 years but that a push to 41 or above has been observed only twice. A January piece calls it only the third time the CAPE has surpassed 40 during a continuous bull market, after January 1999 through September 2000. And a Yahoo-hosted piece says the CAPE crossed 40 for only the second time in history. These are different ways of counting months, years and episodes of the same pair of events. The simple version is that there have been two broad periods of very high valuations: 1999 to 2000 and now. I use that framing.
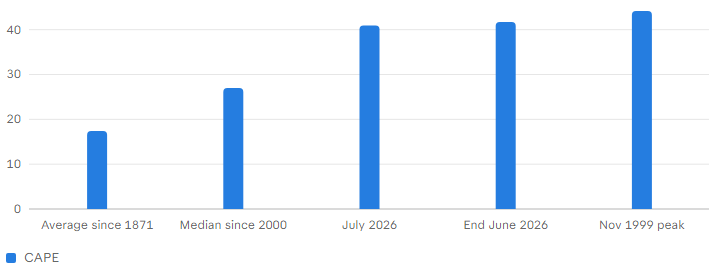
The long-run average since 1871 is about 17.4. Another source puts the median since 2000 at roughly 27, the 50-year level at around 20, and the long-term average at 17.
A simple way to read it: a CAPE of 40 means you pay $40 for each $1 of average real earnings, so the "earnings yield" is 2.5%, against about 5.7% at the 17.4 average (my calculation: 1 divided by 40, and 1 divided by 17. That is a thinner cushion. It does not mean prices must fall quickly, only that the starting point is expensive.
Do note the limitations. The CAPE uses past earnings, so if earnings are growing fast, as they are for many AI-related companies, it can read high for a time. One source argues that structural differences in profitability and technology adoption today make the comparison with the dot-com era less direct. It is a lower-quality aggregator, so treat that as a point of view, not a proof.
On returns, the Fool says the S&P 500 gained 78% over the past three calendar years. A different Yahoo-hosted piece said $10,000 invested three years earlier would be worth about $18,600, which is an 86% gain (my calculation). The difference likely reflects different start and end dates or the use of price versus total returns. Neither is wrong, but be careful comparing them.
For 2026, the S&P 500 was up nearly 11% through 12 November, and had dropped to just above 7% for the year after a 4.4% fall on 5 November. If you combine the 78% with an 11% year, the index is close to doubling over four years (my calculation: 1.78 x 1.11 is about 1.98).
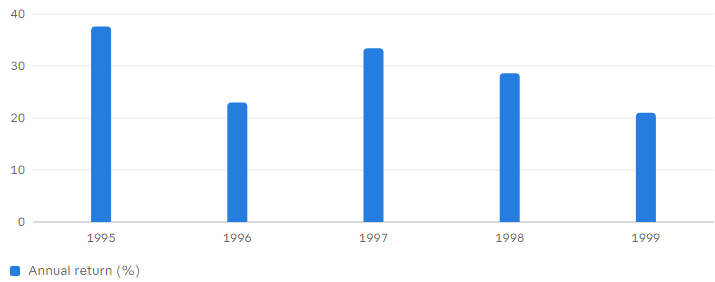
The market kept running for a while after the CAPE crossed 40. One article says the S&P 500 peaked around 12 months after the CAPE crossed 40 in 1999. Between 1995 and 1999 the index had five consecutive years of returns above 20% a year. Investors who sold early lost out on years of very large gains. This is the central lesson of the precedent. The signal was right about the eventual outcome, and wrong about the timing by about a year or more.
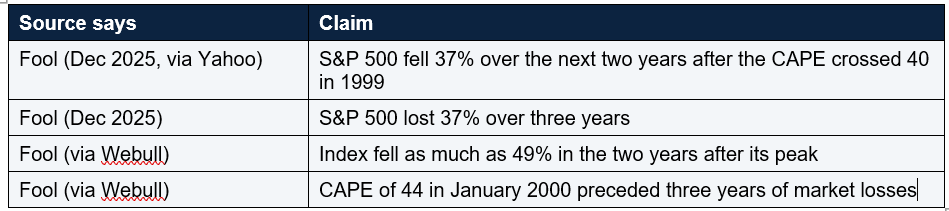
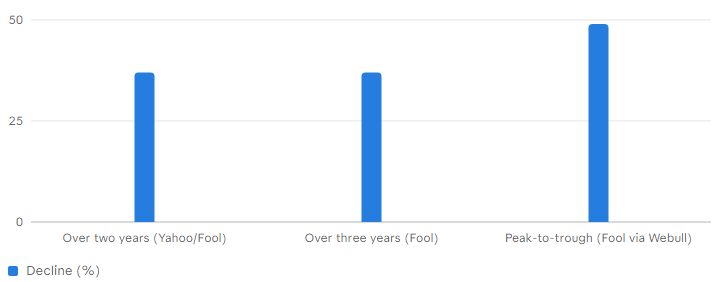
These are all describing roughly the same 2000 to 2002 bear market, but with different start points and windows, so they do not match. The honest summary is that the S&P 500 lost somewhere between about 37% and 49% depending on how you measure it. In dollars, a 49% fall turns $10,000 into $5,100 (my calculation).
One article adds that investors who bought after the CAPE passed 40 probably did not see positive returns for almost a decade. Another cites Invesco research that when the CAPE is around 40, the S&P 500 has on average produced a low-single-digit negative annualised total return over the following ten years. Those long-horizon numbers are worth taking seriously. They are about ten-year outcomes, not next year's. A market can be expensive and still rise for a while, as 1999 showed.
Third, the timing problem. A signal that is early by a year or two is not much use to someone trying to decide what to do this month. Another Fool piece says it plainly: selling everything based on a CAPE above 40 is not the way to go, since investors who sold when the CAPE climbed in the 1990s lost out on years of incredible returns. Fourth, the headline format itself. This family of articles has run since at least December 2025 with changing numbers, "153 years", "154 years", "155 years", and changing definitions. That is a reminder to read the details and not just the headline.
And bear markets, while painful, have historically been followed by recoveries. In an earlier post I covered the data on this. The point is that a high valuation raises risk, but does not remove the benefit of staying invested for the long term.
Interestingly, a January article called the earlier three-year run only the third time in nearly a century that the S&P 500 gained at least 15% for three consecutive years. Different thresholds give different counts, so I would not lean hard on any one "only X times" claim.
What is different: today's biggest companies are profitable, and JPMorgan notes that earnings estimates for AI stocks have more than doubled. Against that, there are headwinds. October's CPI rose 0.4%, more than expected , the Fed has raised rates and may raise them again in December, and the Fool notes worries about the pace of AI infrastructure spending.
I would note that Nvidia's fall this month, which I covered in another post, shows how sensitive the market can be to one large holding. That is an observation, not a sourced claim here.
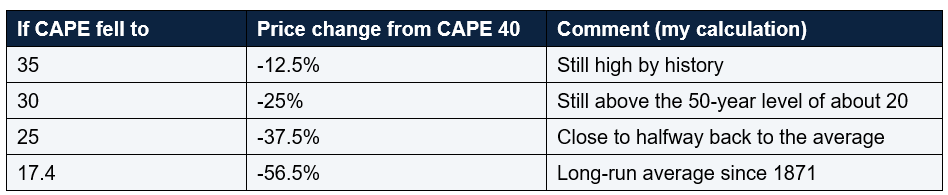
In practice, the CAPE could also come down because earnings grow while prices stay flat, which would be a gentler path. The table just shows how much room there is between today's level and the averages. It is arithmetic, not a prediction.
Rebalance by rule. If stocks have grown to a larger share of your portfolio than you planned, trimming back to your target is not market timing, it is housekeeping.
Think long term. Expect lower average returns than the past few years, but do not assume the worst. Invesco's research points to weak ten-year returns from this level, and also, as 1999 shows, the path can be bumpy and long.
Mistakes to avoid: selling everything because of one valuation signal; assuming a high CAPE means a crash next month; ignoring the signal altogether and holding a portfolio you could not live with if it fell 40%; chasing the biggest winners at the top of the market; and checking your account daily. Another is treating headline counts such as "only twice in 155 years" as precise. The counting differs between articles.
The bull case: earnings are growing, long-run returns over 20 years have been positive since 1919, the three-year streak may extend, and a high CAPE has coexisted with years of gains. The bear case: the CAPE is above 40, a level that preceded declines of about 37% to 49% in 2000 to 2002, ten-year returns have been weak from such levels, inflation and rate hikes are headwinds, and the gains are concentrated. Both can be true at once, which is why valuation is a guide to risk, not a trading signal.
According to the Motley Fool, the S&P 500 Shiller P/E ratio is above 40, which has happened only once before, during the dot-com bubble. Counting methods vary between articles.
What happened after the CAPE hit 40 in 1999?
The market kept rising for about a year, then fell, with sources citing losses of about 37% to 49% over the following two to three years.
Does a high CAPE mean a crash is coming?
Not necessarily. It indicates an expensive market and weaker long-term returns on average, but it is a poor timing tool, and the 1999 signal was early by about a year or more.
Should I sell my stocks now?
That depends on your goals and risk tolerance. One article notes that selling everything on the basis of a CAPE above 40 would have meant missing years of gains in the 1990s. Consider speaking to a regulated adviser.
How much has the S&P 500 gained recently?
The Fool says 78% over the past three calendar years, and nearly 11% in 2026 through 12 November.
Table of Contents
- What is the "something" in the headline?
- What the Shiller P/E measures
- Where the market stands today
- The 1999 to 2000 precedent
- What happened next (and why sources disagree)
- Why "crystal clear" is too strong
- The case against panic
- The three-year streak and the four-year question
- What is similar and different this time
- What a lower valuation would mean: the arithmetic
- What investors can do
- Conclusion
- FAQ
Shiller P/E (CAPE) readings vs long-run average
Shiller P/E ratio by Sources: Motley Fool, Webull.ca; readings vary by date and provider
Reported S&P 500 losses after CAPE crossed 40 in 1999 (%)
% decline by Sources differ on the window; all describe the 2000-2002 bear market
Years of 15%+ gains: S&P 500 in the 1990s streak (%)
Annual return % by Source: Motley Fool (16 Nov 2026)The headline makes it sound like a stopwatch is running. The reality is more modest, and more interesting. The "something" is a valuation reading: the S&P 500's Shiller P/E ratio has moved above 40, a level that has happened only once before, in the dot-com bubble. At the same time, the index has climbed 78% over the past three calendar years, and was up nearly 11% in 2026 through 12 November. That is the "three-year gain" the headline mentions, and it is why valuations are so high.
Is history "crystal clear"? Not really. The article itself rests on only two episodes of a CAPE above 40, which is a very small sample, and it provides no return data to support an expected decline. What history does show is that very high valuations have usually been followed by weaker long-run returns, but with a huge uncertainty on timing. In 1999 the signal was early by years.
Key takeaway: A CAPE above 40 is a real warning about future returns, not a timer. It says the market is expensive, not that a crash is due next month. It is a reason to check your risk, not a reason to panic.
What is the "something" in the headline?
Let me be precise, because this headline family gets repeated with changing details. The Motley Fool has run many versions: "2 times in 153 years", "154 years", "155 years", and others. Some are about the CAPE ratio, some about three years of double-digit gains. The 16 November article is about the CAPE. It says the S&P 500 Shiller P/E has moved above 40, which has happened only once before, during the dot-com bubble.The counting varies by article. The July piece says the CAPE has technically exceeded 40 three times over 155 years but that a push to 41 or above has been observed only twice. A January piece calls it only the third time the CAPE has surpassed 40 during a continuous bull market, after January 1999 through September 2000. And a Yahoo-hosted piece says the CAPE crossed 40 for only the second time in history. These are different ways of counting months, years and episodes of the same pair of events. The simple version is that there have been two broad periods of very high valuations: 1999 to 2000 and now. I use that framing.
What the Shiller P/E measures
The Shiller P/E, or CAPE ratio, divides the S&P 500's price by the average of inflation-adjusted earnings over the previous ten years . Using ten years of earnings smooths out the ups and downs of the business cycle. Economist Robert Shiller developed it.The long-run average since 1871 is about 17.4. Another source puts the median since 2000 at roughly 27, the 50-year level at around 20, and the long-term average at 17.
A simple way to read it: a CAPE of 40 means you pay $40 for each $1 of average real earnings, so the "earnings yield" is 2.5%, against about 5.7% at the 17.4 average (my calculation: 1 divided by 40, and 1 divided by 17. That is a thinner cushion. It does not mean prices must fall quickly, only that the starting point is expensive.
Do note the limitations. The CAPE uses past earnings, so if earnings are growing fast, as they are for many AI-related companies, it can read high for a time. One source argues that structural differences in profitability and technology adoption today make the comparison with the dot-com era less direct. It is a lower-quality aggregator, so treat that as a point of view, not a proof.
Where the market stands today
The readings vary slightly by date and source. At the end of June, the CAPE was 41.72, roughly 140% above its 155-year average, according to a Motley Fool piece. In July it hit 40.91, the highest since August 2000, per another. On 19 October it was nearing 41. The 16 November article says it is above 40 without an exact reading. So I would say it is around 40 to 42, depending on the date and the data provider. The all-time high was 44.19 in November 1999. The Fool's May article called this the second-priciest stock market since January 1871.On returns, the Fool says the S&P 500 gained 78% over the past three calendar years. A different Yahoo-hosted piece said $10,000 invested three years earlier would be worth about $18,600, which is an 86% gain (my calculation). The difference likely reflects different start and end dates or the use of price versus total returns. Neither is wrong, but be careful comparing them.
For 2026, the S&P 500 was up nearly 11% through 12 November, and had dropped to just above 7% for the year after a 4.4% fall on 5 November. If you combine the 78% with an 11% year, the index is close to doubling over four years (my calculation: 1.78 x 1.11 is about 1.98).
The 1999 to 2000 precedent
The dot-com bubble is the main comparison. From January 1999 through September 2000, the CAPE was above 40. It peaked at 44.19 in November 1999 per one source, though other pieces say December 1999 or January 2000. The exact month is not important.The market kept running for a while after the CAPE crossed 40. One article says the S&P 500 peaked around 12 months after the CAPE crossed 40 in 1999. Between 1995 and 1999 the index had five consecutive years of returns above 20% a year. Investors who sold early lost out on years of very large gains. This is the central lesson of the precedent. The signal was right about the eventual outcome, and wrong about the timing by about a year or more.
What happened next (and why sources disagree)
How bad were the declines? The sources disagree on the numbers, so here they are side by side.These are all describing roughly the same 2000 to 2002 bear market, but with different start points and windows, so they do not match. The honest summary is that the S&P 500 lost somewhere between about 37% and 49% depending on how you measure it. In dollars, a 49% fall turns $10,000 into $5,100 (my calculation).
One article adds that investors who bought after the CAPE passed 40 probably did not see positive returns for almost a decade. Another cites Invesco research that when the CAPE is around 40, the S&P 500 has on average produced a low-single-digit negative annualised total return over the following ten years. Those long-horizon numbers are worth taking seriously. They are about ten-year outcomes, not next year's. A market can be expensive and still rise for a while, as 1999 showed.
Why "crystal clear" is too strong
The headline says history is "crystal clear". I would push back on that, and so does the evidence. First, the sample is tiny. With only two episodes above 40, any conclusion is built on a handful of data points. You cannot draw a statistical certainty from two events. Second, the article provides no return data for its claim that a decline is coming. The author concludes the S&P 500 "could be heading for a decline", not that it will, and notes that long-term holders of quality stocks have historically recovered.Third, the timing problem. A signal that is early by a year or two is not much use to someone trying to decide what to do this month. Another Fool piece says it plainly: selling everything based on a CAPE above 40 is not the way to go, since investors who sold when the CAPE climbed in the 1990s lost out on years of incredible returns. Fourth, the headline format itself. This family of articles has run since at least December 2025 with changing numbers, "153 years", "154 years", "155 years", and changing definitions. That is a reminder to read the details and not just the headline.
The case against panic
Here is the other side. Crestmont Research found that since 1919 the S&P 500 has earned a positive total return over every 20-year period, no matter how volatile the years in between. For a long-horizon investor, that is reassuring, though it does not promise the same going forward. Earnings have also been growing. JPMorgan's Jacob Manoukian wrote that over the past three years the forward price-to-earnings multiple of publicly traded AI stocks has declined while earnings per share estimates have more than doubled. If earnings keep growing, a high CAPE can be partly "grown into" over time.And bear markets, while painful, have historically been followed by recoveries. In an earlier post I covered the data on this. The point is that a high valuation raises risk, but does not remove the benefit of staying invested for the long term.
The three-year streak and the four-year question
Now the streak. The Fool's second 16 November article notes that the S&P 500 is on pace for four consecutive years of double-digit gains, something it has done only three times in its 103-year history. Those earlier streaks were 1942 to 1945, 1949 to 1952, and 1995 to 1999, which ran to five years. The author leans towards the index extending the streak rather than ending the year in single digits, but says "eventually, the streak has to stop". At nearly 11% through 12 November, the year is still above the double-digit line, though a 4.4% fall on 5 November briefly pulled it to just over 7%. There are about six weeks left, so anything could happen.Interestingly, a January article called the earlier three-year run only the third time in nearly a century that the S&P 500 gained at least 15% for three consecutive years. Different thresholds give different counts, so I would not lean hard on any one "only X times" claim.
What is similar and different this time
What is similar to 1999: very high valuations, a technology story, and years of strong returns. Between 2023 and now the gains have been driven by a few mega-cap stocks. The Fool notes that since 2023, Nvidia is up 995%, Meta 416%, Alphabet 234%, Amazon 223%, Tesla 217%, Apple 176% and Microsoft 119%, and that Nvidia is the largest holding at 8.39% of the index.What is different: today's biggest companies are profitable, and JPMorgan notes that earnings estimates for AI stocks have more than doubled. Against that, there are headwinds. October's CPI rose 0.4%, more than expected , the Fed has raised rates and may raise them again in December, and the Fool notes worries about the pace of AI infrastructure spending.
I would note that Nvidia's fall this month, which I covered in another post, shows how sensitive the market can be to one large holding. That is an observation, not a sourced claim here.
What a lower valuation would mean: the arithmetic.
This is a purely illustrative calculation, not a forecast. If the CAPE moved back from 40 to a lower level, and the ten-year average earnings stayed the same, the price would have to fall by the same proportion. Real earnings would likely grow in the meantime, which would soften the effect.In practice, the CAPE could also come down because earnings grow while prices stay flat, which would be a gentler path. The table just shows how much room there is between today's level and the averages. It is arithmetic, not a prediction.
What investors can do
What can ordinary investors do? Here are ideas, offered as education and not advice. Check your mix. If a fall of 30% to 40% would force you to sell, you may have more in stocks than you can hold. Match your stock share to your time horizon. Keep investing regularly. Spreading purchases over time means you buy more shares when prices fall, and removes the pressure to pick a moment. Hold a cash buffer. An emergency fund and money for planned spending means you do not have to sell shares at a bad time. Diversify. The Fool notes that much of the gain has come from a handful of mega-cap tech stocks. A broad fund holds those, but you may want to look at how much of your wealth is tied to the same names.Rebalance by rule. If stocks have grown to a larger share of your portfolio than you planned, trimming back to your target is not market timing, it is housekeeping.
Think long term. Expect lower average returns than the past few years, but do not assume the worst. Invesco's research points to weak ten-year returns from this level, and also, as 1999 shows, the path can be bumpy and long.
Mistakes to avoid: selling everything because of one valuation signal; assuming a high CAPE means a crash next month; ignoring the signal altogether and holding a portfolio you could not live with if it fell 40%; chasing the biggest winners at the top of the market; and checking your account daily. Another is treating headline counts such as "only twice in 155 years" as precise. The counting differs between articles.
The bull case: earnings are growing, long-run returns over 20 years have been positive since 1919, the three-year streak may extend, and a high CAPE has coexisted with years of gains. The bear case: the CAPE is above 40, a level that preceded declines of about 37% to 49% in 2000 to 2002, ten-year returns have been weak from such levels, inflation and rate hikes are headwinds, and the gains are concentrated. Both can be true at once, which is why valuation is a guide to risk, not a trading signal.
Conclusion
The market is doing something rare: its Shiller P/E has moved above 40, a level seen only around the dot-com peak. After a 78% gain in three years, that is not surprising, and it is worth respecting. But history is not "crystal clear". It is built on two episodes, the timing was off by a year or more in 1999, and long-run investors have still been rewarded. The sensible response is not to flee, but to check that your portfolio matches your goals and risk tolerance, keep investing steadily, and hold a buffer. This post is education only, not advice.FAQ
What is the "something" the stock market is doing?According to the Motley Fool, the S&P 500 Shiller P/E ratio is above 40, which has happened only once before, during the dot-com bubble. Counting methods vary between articles.
What happened after the CAPE hit 40 in 1999?
The market kept rising for about a year, then fell, with sources citing losses of about 37% to 49% over the following two to three years.
Does a high CAPE mean a crash is coming?
Not necessarily. It indicates an expensive market and weaker long-term returns on average, but it is a poor timing tool, and the 1999 signal was early by about a year or more.
Should I sell my stocks now?
That depends on your goals and risk tolerance. One article notes that selling everything on the basis of a CAPE above 40 would have meant missing years of gains in the 1990s. Consider speaking to a regulated adviser.
How much has the S&P 500 gained recently?
The Fool says 78% over the past three calendar years, and nearly 11% in 2026 through 12 November.
0 Comments
Be the first to share your thoughts on this article.