
Investing
The Cash Cow to Buy Now: How to Spot a True Cash Cow

S&P 500 free-cash-flow yield at record lows; Amazon, Alphabet, Meta, Microsoft and Oracle expected to post negative free cash flow of about $141 billion over 12 months; high-FCF stocks up 43% year to date; another CNBC analysis put the S&P 500 FCF yield at about 4%. The 52-week T-bill yields about 4.46% and the 10-year about 4.93%. Case studies: Danaher FY2025 free cash flow $5.26 billion, of which about $3.97 billion (75%) went to buybacks and dividends; Alphabet FY2025 free cash flow $73.27 billion on $164.7 billion of operating cash flow (about 44% conversion) with 2026 capex guided to $180–$190 billion. Cash-flow ETFs: COWZ about $18 billion in assets, 0.49% expense ratio; its benchmark had a 6% FCF yield vs 2.6% for the Russell 1000 in March 2026. A $100 billion company with $6 billion of free cash flow has a 6% yield; a 30% drop in free cash flow cuts it to 4.2% at a constant price.
I want to be upfront: headlines love to name the cash cow to buy now, a single stock with a tidy story. I could pick one, but I would be guessing at your situation, and prices move. What I can do is more useful: explain what a real cash cow looks like, show what the 2026 data say, walk through two case studies and give you a checklist for judging any candidate.
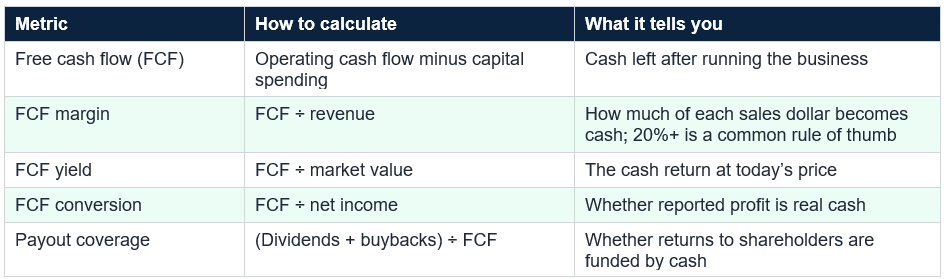
FCF conversion is free cash flow divided by net income, showing whether profits are real cash. Payout coverage is dividends plus buybacks divided by free cash flow, showing whether shareholder returns are funded by cash or debt. A true cash cow scores well on all five; many stocks score well on one and are marketed on that alone.
Bank of America calls free cash flow yield the best measure of quality because it is difficult to manipulate and comparable across companies. Among non-AI names it rated Buy, Allstate stood out with an 18% yield, though FactSet’s average analyst rating on it was Hold. Another CNBC analysis put the technology sector’s FCF yield roughly in line with the S&P 500’s average of about 4%, so the numbers depend on how you measure. Either way, cash is in demand, and anything popular becomes expensive.
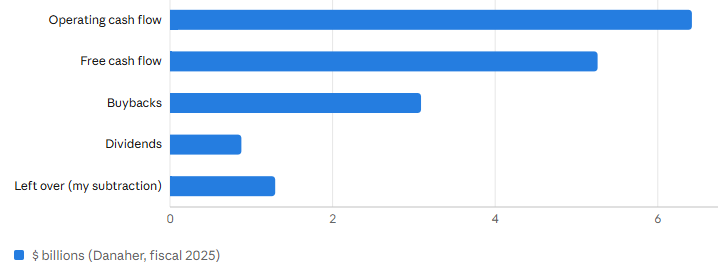
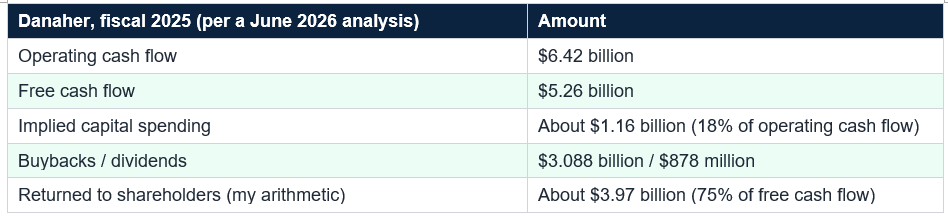
Danaher returned $3.088 billion through buybacks and $878 million in dividends, about $3.97 billion or 75% of free cash flow, leaving about $1.29 billion for acquisitions and debt. Its quarterly dividend grew from $0.025 in 2013 to $0.40 in early 2026. But a cash cow can still be a poor stock: the article noted shares were down nearly 20% for the year at the time, and a pending Masimo acquisition adds execution risk. Those figures are several months old.
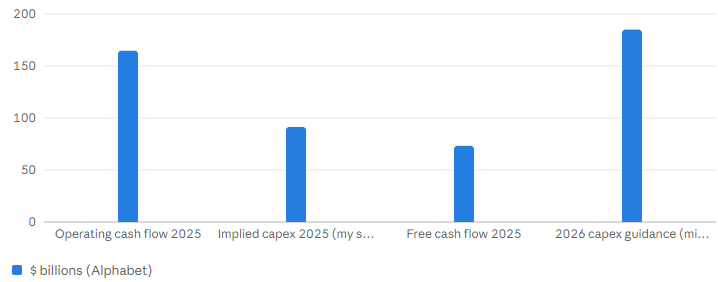
But the article noted 2026 capital spending was guided to $180 billion to $190 billion, roughly double the implied 2025 level, and first-quarter free cash flow fell about 47% as capex more than doubled. That is the 2026 trap: huge operating cash flow and shrinking free cash flow because of heavy investment, which is what Bank of America’s record-low yield reflects. Whether the spending pays off is the real question.
Third, underinvestment: cutting maintenance spending boosts free cash flow for a few years while assets decay. Fourth, stock-based compensation, which can flatter free cash flow while diluting shareholders. Fifth, debt-funded payouts: if dividends and buybacks exceed free cash flow, the cash cow is borrowing to look generous. In every case, ask whether the cash flow will repeat. A high free cash flow yield is a question, not an answer: it can mean a bargain, or that the market expects the cash flow to disappear.
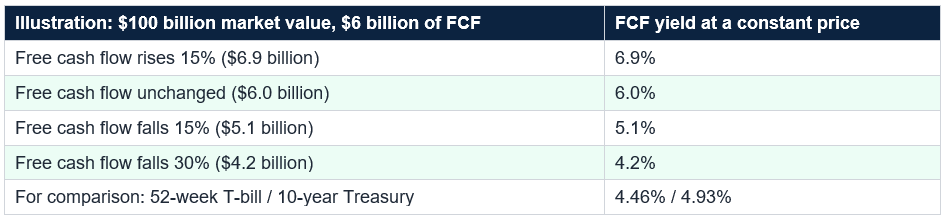
Here is the sensitivity, in my illustration. A company with $6 billion of free cash flow and a $100 billion market value has a 6% yield. If free cash flow falls 15%, the yield at a constant price drops to 5.1%; if it falls 30%, to 4.2%, below a T-bill. On $10,000, a 6% yield represents $600 of annual cash flow versus $446 from a T-bill. The cash belongs to the company, but it supports dividends, buybacks and the share price over time.
The trade-offs are real. COWZ reconstitutes quarterly and has had big sector tilts, about 19.7% in healthcare and 12% to 16% in energy at various points this year. One analyst noted its frequency of positive monthly returns is relatively low, and its total return was about 4.2% for the year through early April. It costs 0.49%, about $49 a year on $10,000, whereas broad index funds charge a few hundredths of a percent.
You can find the numbers in the cash flow statement of a company’s annual report, free on the SEC’s EDGAR site. If you cannot answer the seventh question in a sentence, do not buy yet. The best cash cow on paper can still be a poor investment at a high price: a great business and a good return are different things.
Pick one company you are curious about, pull its last three years of operating cash flow and capital spending from its annual reports, compute FCF, FCF margin, conversion and yield, and compare the yield with a T-bill. If the numbers do not beat the alternatives with a margin of safety, keep looking.
So judge any candidate by five metrics, beware of windfalls, underinvestment and debt-funded payouts and compare the yield with Treasuries. Consider a cash-flow ETF if you would rather not pick, and keep positions modest. A real cash cow rewards patience and scrutiny, not headlines. A qualified adviser can help you decide what fits.
A company that generates large, steady free cash flow (cash from operations minus capital spending) relative to its size. Mature businesses with strong market positions and modest reinvestment needs tend to qualify. Some sources use a free cash flow margin of 20% or more as a rule of thumb, though the right threshold varies by industry.
What is free cash flow yield?
It is free cash flow divided by market capitalization, or per-share cash flow divided by the share price. A company with $6 billion of free cash flow and a $100 billion market value has a 6% yield. Bank of America calls free cash flow yield its preferred measure of quality because it is hard to manipulate and comparable across companies.
Is a high free cash flow yield always a bargain?
No. A very high yield can reflect a depressed price, a temporary windfall, cyclical cash flow or capital spending cut too far. Screens in 2026 showed energy and other cyclical stocks with yields above 30%. Check why the yield is high and whether the cash flow will last.
Are cash cow ETFs a safer way to buy?
They spread risk across about 100 stocks but are not safe from market declines. COWZ holds the 100 Russell 1000 stocks with the highest free cash flow yield and charges 0.49%; it reconstitutes quarterly and has had large healthcare and energy tilts. This is general education, not personal advice.
So which stock is the cash cow to buy now?
No single stock can honestly be called the one to buy. The better answer is a method: screen for free cash flow yield, margin and conversion, check that cash flow is durable, compare the yield with Treasuries and keep any position small. The Danaher and Alphabet case studies show what to look for and what can go wrong.
Table of Contents
- The Promise of the Cash Cow
- The Short Answer
- What Makes a Cash Cow: Five Metrics
- Why Cash Cows Are in Demand in 2026
- Case Study 1: Danaher, a Cash Cow by the Numbers
- Case Study 2: Alphabet, a Cash Machine in a Spending Cycle
- The Traps: When High Free Cash Flow Misleads
- The Yield Math: Compare With Treasuries
- Cash Cow ETFs
- A Seven-Point Cash Cow Checklist
- Fitting a Cash Cow Into a Portfolio
- Conclusion
- Frequently Asked Questions
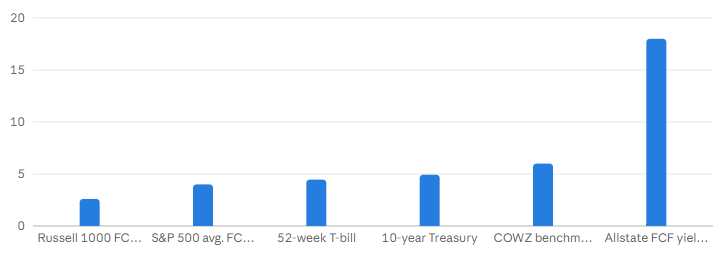
Free cash flow yield vs. Treasuries: what the market pays in cash flow (%)
Yield (%) by Pacer via U.S. News; CNBC; MyMoneyBlog; The Mortgage Reports; Bank of America via CNBC. Measures and dates differ
Case study 1: where Danaher's cash went, fiscal 2025 ($ billions)
$ billions by Motley Fool analysis via AOL (about June 2026); 75% of free cash flow returned to shareholders (my arithmetic)
Case study 2: Alphabet's cash machine and its 2026 spending cycle ($ billions)
$ billions by 24/7 Wall St. (June 9, 2026); capex has to be funded from operating cash flow, so free cash flow is squeezed
The Promise of the Cash Cow
There is an irresistible simplicity to the idea of a cash cow: a business that earns more cash than it needs, year after year, and hands the surplus back through dividends and buybacks. In a year when inflation is 3.7% and the Fed is deciding between holding and hiking, the appeal is understandable.I want to be upfront: headlines love to name the cash cow to buy now, a single stock with a tidy story. I could pick one, but I would be guessing at your situation, and prices move. What I can do is more useful: explain what a real cash cow looks like, show what the 2026 data say, walk through two case studies and give you a checklist for judging any candidate.
The Short Answer
A true cash cow generates strong, durable free cash flow relative to its size, converts most of its profits into cash and returns a sensible share to shareholders. Judge one with five numbers: free cash flow, FCF margin, FCF yield, FCF conversion and payout coverage. A high yield is not enough: it must be sustainable and should compare well with Treasuries, which pay about 4.46% for a one-year bill. Treat any single-stock pick as research to verify, not a buy order.What Makes a Cash Cow: Five Metrics
Free cash flow is operating cash flow minus capital expenditures, the cash left after running and maintaining the business, available for dividends, buybacks, debt repayment and acquisitions. Five ratios turn it into a judgment. FCF margin is free cash flow divided by revenue; one often-cited rule of thumb calls a margin of 20% or more a cash cow. FCF yield is free cash flow divided by market value, the cash return you buy at today’s price.FCF conversion is free cash flow divided by net income, showing whether profits are real cash. Payout coverage is dividends plus buybacks divided by free cash flow, showing whether shareholder returns are funded by cash or debt. A true cash cow scores well on all five; many stocks score well on one and are marketed on that alone.
Why Cash Cows Are in Demand in 2026
Free cash flow has become a story this year because the biggest companies are spending heavily on artificial intelligence. Bank of America strategist Jared Woodard said in September that the S&P 500’s free-cash-flow yield was at record lows and that Amazon, Alphabet, Meta Platforms, Microsoft and Oracle were expected to post negative free cash flow of about $141 billion together over 12 months. His view: buy what is scarce. High-free-cash-flow stocks were up 43% year to date, on pace for a record.Bank of America calls free cash flow yield the best measure of quality because it is difficult to manipulate and comparable across companies. Among non-AI names it rated Buy, Allstate stood out with an 18% yield, though FactSet’s average analyst rating on it was Hold. Another CNBC analysis put the technology sector’s FCF yield roughly in line with the S&P 500’s average of about 4%, so the numbers depend on how you measure. Either way, cash is in demand, and anything popular becomes expensive.
Case Study 1: Danaher, a Cash Cow by the Numbers
Danaher, the life sciences and diagnostics company, is a textbook illustration, according to a Motley Fool analysis from around June. It reported free cash flow of $5.26 billion in fiscal 2025 on $6.42 billion of operating cash flow, implying capital spending of about $1.16 billion, or 18% of operating cash flow, by my arithmetic. Free cash flow was 105% of net income in the first quarter of 2026, and management guided to more than $5 billion for the year.Danaher returned $3.088 billion through buybacks and $878 million in dividends, about $3.97 billion or 75% of free cash flow, leaving about $1.29 billion for acquisitions and debt. Its quarterly dividend grew from $0.025 in 2013 to $0.40 in early 2026. But a cash cow can still be a poor stock: the article noted shares were down nearly 20% for the year at the time, and a pending Masimo acquisition adds execution risk. Those figures are several months old.
Case Study 2: Alphabet, a Cash Machine in a Spending Cycle
Alphabet shows the opposite problem: enormous cash generation plowed back into infrastructure. According to a 24/7 Wall St. analysis in June, Alphabet produced $73.27 billion of free cash flow in 2025 on operating cash flow of $164.7 billion, implying capital spending of about $91.4 billion and conversion of about 44%. It bought back $108 billion of stock over two years. By any measure it is a cash machine.But the article noted 2026 capital spending was guided to $180 billion to $190 billion, roughly double the implied 2025 level, and first-quarter free cash flow fell about 47% as capex more than doubled. That is the 2026 trap: huge operating cash flow and shrinking free cash flow because of heavy investment, which is what Bank of America’s record-low yield reflects. Whether the spending pays off is the real question.
The Traps: When High Free Cash Flow Misleads
Screens for free cash flow can mislead in five ways. First, cyclical windfalls: one screen listed SM Energy at a 61.7% free cash flow yield because commodity prices were high and the market doubts they will last. Second, financial companies: a screen led by ServisFirst Bancshares at a 74.2% FCF margin shows how banks can look like cash cows, though cash flow for financial firms is not comparable.Third, underinvestment: cutting maintenance spending boosts free cash flow for a few years while assets decay. Fourth, stock-based compensation, which can flatter free cash flow while diluting shareholders. Fifth, debt-funded payouts: if dividends and buybacks exceed free cash flow, the cash cow is borrowing to look generous. In every case, ask whether the cash flow will repeat. A high free cash flow yield is a question, not an answer: it can mean a bargain, or that the market expects the cash flow to disappear.
The Yield Math: Compare With Treasuries
A cash cow has to beat the alternatives. A 52-week Treasury bill paid about 4.46% in October and the 10-year yielded about 4.93% on October 29. If the S&P 500’s average free cash flow yield is about 4%, as one analysis suggests, the market pays less in cash flow than a T-bill, so equity investors are counting on growth. A 6% FCF yield, like the benchmark behind COWZ in March, offers about 1.5 points more than a T-bill, with the risk that the cash flow shrinks.Here is the sensitivity, in my illustration. A company with $6 billion of free cash flow and a $100 billion market value has a 6% yield. If free cash flow falls 15%, the yield at a constant price drops to 5.1%; if it falls 30%, to 4.2%, below a T-bill. On $10,000, a 6% yield represents $600 of annual cash flow versus $446 from a T-bill. The cash belongs to the company, but it supports dividends, buybacks and the share price over time.
Cash Cow ETFs
Funds screen for free cash flow for you. The Pacer US Cash Cows 100 ETF (COWZ), with about $18 billion in assets and a 0.49% expense ratio, starts with the Russell 1000, ranks stocks by trailing free cash flow yield and holds the top 100, weighted by yield. According to Pacer, via U.S. News, its benchmark had a 6% free cash flow yield in March 2026 versus 2.6% for the Russell 1000, and traded at about 18 times earnings versus 26. The Distillate U.S. Fundamental Stability and Value ETF (DSTL) charges 0.39%.The trade-offs are real. COWZ reconstitutes quarterly and has had big sector tilts, about 19.7% in healthcare and 12% to 16% in energy at various points this year. One analyst noted its frequency of positive monthly returns is relatively low, and its total return was about 4.2% for the year through early April. It costs 0.49%, about $49 a year on $10,000, whereas broad index funds charge a few hundredths of a percent.
A Seven-Point Cash Cow Checklist
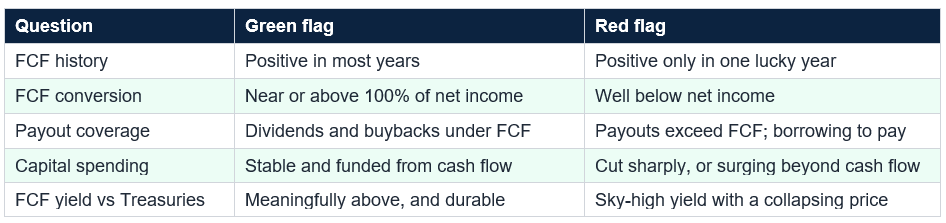
Use these questions on any candidate. One: is free cash flow positive in most years, not just this one? Two: is the FCF margin high for its industry, and is it stable? Three: does FCF conversion run near or above 100% of net income? Four: what is the FCF yield, and how does it compare with a T-bill and the 10-year? Five: are dividends and buybacks covered by free cash flow, or by debt? Six: how much is capital spending, and is the company underinvesting or in a heavy spending cycle? Seven: what could break the cash flow, such as commodity prices, regulation or competition?You can find the numbers in the cash flow statement of a company’s annual report, free on the SEC’s EDGAR site. If you cannot answer the seventh question in a sentence, do not buy yet. The best cash cow on paper can still be a poor investment at a high price: a great business and a good return are different things.
Fitting a Cash Cow Into a Portfolio
Cash cows are often called defensive, but they are still stocks. The biggest risks are paying too much, concentrating in one name or mistaking a cyclical windfall for permanent income. Treat a cash cow as one position among many, sized so a 30% drop would not change your plans.Pick one company you are curious about, pull its last three years of operating cash flow and capital spending from its annual reports, compute FCF, FCF margin, conversion and yield, and compare the yield with a T-bill. If the numbers do not beat the alternatives with a margin of safety, keep looking.
Conclusion
The cash cow to buy now is less a single stock than a set of habits. In 2026, free cash flow is scarce at the biggest companies, with five AI giants expected to burn about $141 billion over the next year, and high-FCF stocks were up 43% by September. That has made cash cows popular, and popularity has a price. The case studies show both sides: Danaher returns 75% of its free cash flow, yet its stock fell, while Alphabet generates $73 billion of free cash flow and is spending far more next year.So judge any candidate by five metrics, beware of windfalls, underinvestment and debt-funded payouts and compare the yield with Treasuries. Consider a cash-flow ETF if you would rather not pick, and keep positions modest. A real cash cow rewards patience and scrutiny, not headlines. A qualified adviser can help you decide what fits.
Frequently Asked Questions
What is a cash cow stock?A company that generates large, steady free cash flow (cash from operations minus capital spending) relative to its size. Mature businesses with strong market positions and modest reinvestment needs tend to qualify. Some sources use a free cash flow margin of 20% or more as a rule of thumb, though the right threshold varies by industry.
What is free cash flow yield?
It is free cash flow divided by market capitalization, or per-share cash flow divided by the share price. A company with $6 billion of free cash flow and a $100 billion market value has a 6% yield. Bank of America calls free cash flow yield its preferred measure of quality because it is hard to manipulate and comparable across companies.
Is a high free cash flow yield always a bargain?
No. A very high yield can reflect a depressed price, a temporary windfall, cyclical cash flow or capital spending cut too far. Screens in 2026 showed energy and other cyclical stocks with yields above 30%. Check why the yield is high and whether the cash flow will last.
Are cash cow ETFs a safer way to buy?
They spread risk across about 100 stocks but are not safe from market declines. COWZ holds the 100 Russell 1000 stocks with the highest free cash flow yield and charges 0.49%; it reconstitutes quarterly and has had large healthcare and energy tilts. This is general education, not personal advice.
So which stock is the cash cow to buy now?
No single stock can honestly be called the one to buy. The better answer is a method: screen for free cash flow yield, margin and conversion, check that cash flow is durable, compare the yield with Treasuries and keep any position small. The Danaher and Alphabet case studies show what to look for and what can go wrong.
0 Comments
Be the first to share your thoughts on this article.