

Investing
$10k in the 3 Best Fidelity Index Funds: Full Maths
FXAIX has returned +14.80% per year over the past decade and costs $1.50 per year to own on $10,000. FZROX is completely free. FSKAX spans 3,700+ US stocks at 0.015%. If you invested $10,000 across these three Fidelity index funds — split equally at $3,333 each — the compound maths over 10, 20, and 30 years produces numbers that make the coffee-a-day comparison feel very real. This guide shows every scenario, every fee, and every caveat. Not financial advice.
Fidelity manages over $17 trillion in assets under administration (Mezzi.com, 2026). Its index fund lineup includes FXAIX (the S&P 500 tracker with a 10-year return of +14.80% per year and a $740 billion asset base), FZROX (the zero-expense-ratio total market fund that charges literally nothing to own), and FSKAX (the portable total market fund tracking the Dow Jones U.S. Total Stock Market Index across 3,700+ US companies). These three funds represent the core of what Fidelity does best: broad US market exposure at the lowest possible cost, available with no minimum investment through fractional shares.
The three funds were chosen because they consistently appear on every credible list of best Fidelity index funds, because their combined characteristics (the S&P 500’s track record, the total market’s breadth, and the zero-fee advantage) represent three slightly different investment philosophies in the US equity space, and because the comparison between them is instructive in ways that go beyond just the headline return number. This article models $10,000 in each fund separately and split equally, at multiple return rate scenarios, over 1, 5, 10, 20, and 30 years. Not financial advice.
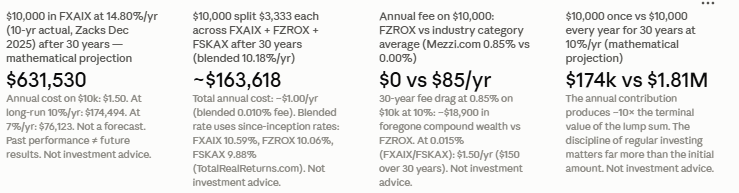
Fidelity AUM: $17 trillion+ (Mezzi.com 2026). FXAIX net assets: ~$740bn; 10-yr return +14.80%/yr; expense ratio 0.015% ($1.50/yr on $10k). FZROX 1-yr +17.77%; since-inception +10.06%/yr; expense ratio 0.00% ($0/yr). FSKAX 3,700+ stocks; since-inception +9.88%/yr; expense ratio 0.015% ($1.50/yr on $10k). Minimum investment in all three: $1 (fractional shares). $10,000 at 10%/yr for 30 years: ~$174,494. $10,000 at 14.80%/yr (FXAIX 10-yr actual) for 30 years: ~$631,530. Sources: Mezzi.com; TotalRealReturns.com; Zacks; NerdWallet. Not investment advice.
The expense ratio is 0.015% per year. On $10,000, that is $1.50 annually — the price of a gas station coffee to own a piece of America’s 500 largest corporations for an entire year. The 10-year annualised return to December 31, 2025 is +14.80% per year (Zacks). The 3-year is +22.99%. The 5-year is +14.41%. Since inception in May 2011, the fund has returned +13.89% per year. In Morningstar’s database, FXAIX ranks in the 2nd percentile of its category over 10 years — outperforming 98% of comparable funds, almost entirely because its near-zero expense ratio allows it to track the market without compounding fee drag into the return.
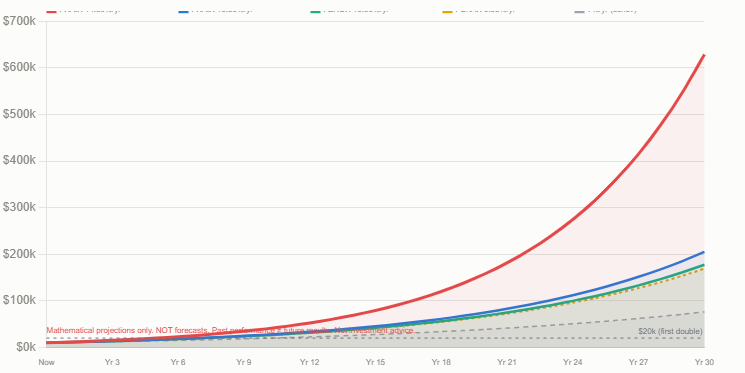
$10,000 invested in FXAIX at its 10-year actual return of 14.80% per year grows to approximately $19,955 in 5 years, $39,819 in 10 years, $158,558 in 20 years, and $631,530 in 30 years. At the more conservative long-run S&P 500 average of 10% per year, the same $10,000 grows to $16,105 in 5 years, $25,937 in 10 years, $67,275 in 20 years, and $174,494 in 30 years. The enormous difference between the 10% and 14.80% scenarios over 30 years ($174,494 vs $631,530) illustrates the compounding power of even a few percentage points of annual return difference sustained over decades. Not investment advice.
FXAIX — Fidelity 500 Index Fund: Expense ratio: 0.015% ($1.50/yr on $10k). Tracks: S&P 500 (500 largest US companies). Net assets: ~$740bn. Minimum investment: $1. 1-year return (to Jun 29 2026): +16.99%. 3-year: +22.99%. 5-year: +14.41%. 10-year: +14.80%. Since inception (May 2011): +13.89%. $10,000 at 14.80% for 10 yrs: ~$39,819. $10,000 at 10% for 10 yrs: ~$25,937. Morningstar: 2nd percentile in category, 10-yr. Portable: yes (available at multiple brokers). Sources: Zacks Dec 31 2025; TotalRealReturns.com; NerdWallet. Not investment advice.
FZROX holds approximately 2,600 US stocks, covering large, mid, and small-cap companies. On $10,000 invested, the annual cost is exactly $0.00. Since its August 2018 inception through June 2026, FZROX has returned +10.06% per year in total (+112.95% cumulative, TotalRealReturns.com). Its 1-year return to June 29, 2026 is +17.77%; its 3-year annualised return is +16.83%; its 5-year is +7.65%. Morningstar rates it a Gold Medalist with a 3-star overall rating. $10,000 invested in FZROX at its since-inception rate of 10.06% per year grows to approximately $16,150 in 5 years, $26,065 in 10 years, $67,939 in 20 years, and $177,022 in 30 years.
The one significant caveat for FZROX is portability. Because it uses a proprietary Fidelity index, the zero-fee share class cannot be transferred to another broker in kind. If you decide to move your account from Fidelity to Vanguard or Schwab, you would need to sell your FZROX position first — triggering a taxable capital gain in a non-sheltered account — and reinvest at the new broker. For investors committed to Fidelity for the long term, and particularly for those holding FZROX inside a Roth IRA (where the sale would be tax-free), this is a manageable consideration. For investors who might switch platforms, FSKAX’s portability may be worth the $1.50 per year cost difference.
FZROX — Fidelity ZERO Total Market Index Fund: Expense ratio: 0.00% ($0/yr on $10k). Tracks: Fidelity U.S. Total Market Index (proprietary). Holdings: ~2,600 US stocks. Minimum investment: $1. 1-year return (to Jun 29 2026): +17.77%. 3-year: +16.83%/yr. 5-year: +7.65%/yr. Since inception (Aug 2018): +10.06%/yr (+112.95% total). $10,000 at 10.06% for 10 yrs: ~$26,065. Morningstar: Gold Medalist, 3-star. CAVEAT: Fidelity-only; proprietary index; not transferable in-kind to other brokers. Sources: Mezzi.com; TotalRealReturns.com; NerdWallet. Not investment advice.
FSKAX holds over 3,700 US stocks (compared to FZROX’s approximately 2,600), making it technically the most broadly diversified US equity fund of the three. The additional 1,100+ stocks relative to FZROX are primarily very small companies — micro-cap and nano-cap stocks that individually represent tiny weights in the fund. In practice, the difference in performance between FSKAX and FZROX is negligible over most time horizons: from August 2018 to June 2026, FSKAX returned +9.88% per year versus FZROX’s +10.06% — a difference of 0.18% per year, which is entirely consistent with normal tracking variation rather than a fundamental difference in investment quality.
$10,000 invested in FSKAX at its since-inception rate of 9.88% per year grows to approximately $16,046 in 5 years, $25,748 in 10 years, $66,296 in 20 years, and $170,688 in 30 years. These figures are virtually indistinguishable from the FZROX projections at a similar rate, which is the point: for a buy-and-hold investor who never leaves Fidelity, the choice between FZROX and FSKAX is largely philosophical. Not investment advice.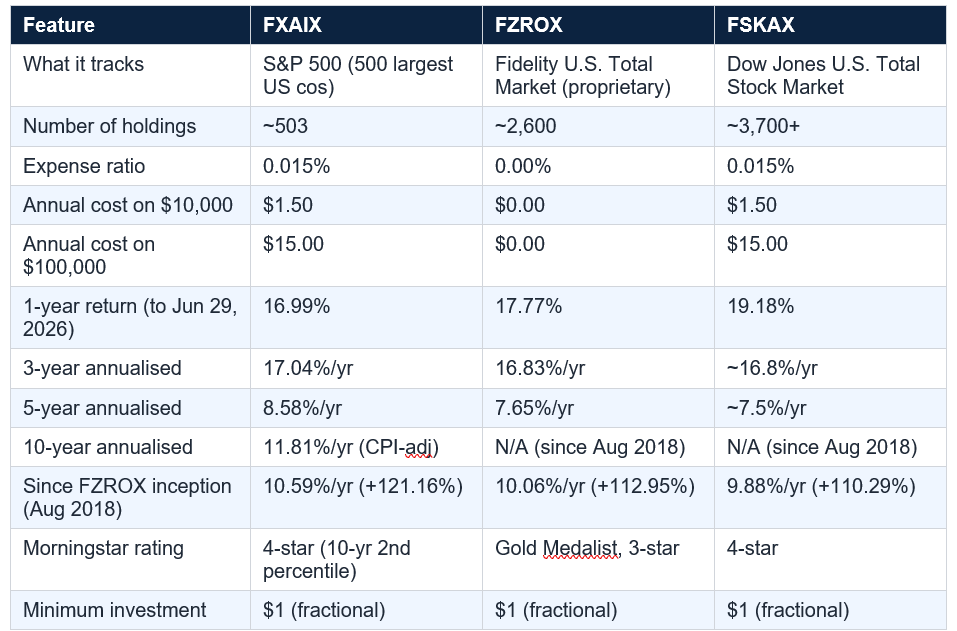
The overlap is real. FXAIX’s holdings are almost entirely contained within both FZROX and FSKAX. The 500 S&P 500 companies are the largest components of both total market funds. Splitting $10,000 equally across these three funds does not provide meaningful diversification within US equities — it is closer to a single large-cap US equity exposure, with modest incremental weights on mid- and small-cap US companies from the two total market funds.
That said, there is a practical case for the equal split, particularly for a $10,000 first investment. It allows an investor to get real-money experience with all three funds, observe how they behave differently during different market conditions (large-cap vs total market performance diverges in some years), and decide over time which allocation they prefer before committing a larger sum to one fund. The scenario-modelling value is genuine even if the diversification benefit is modest.
A more genuinely diversified $10,000 Fidelity allocation might include one of the three US equity funds (say $5,000 in FXAIX), an international fund (say $3,000 in FZILX — Fidelity ZERO International Index Fund, 0.00% expense ratio), and a bond fund (say $2,000 in FXNAX — Fidelity ZERO Total Bond Index Fund, 0.00% expense ratio). This three-fund portfolio approach provides genuine asset-class diversification. Not investment advice.
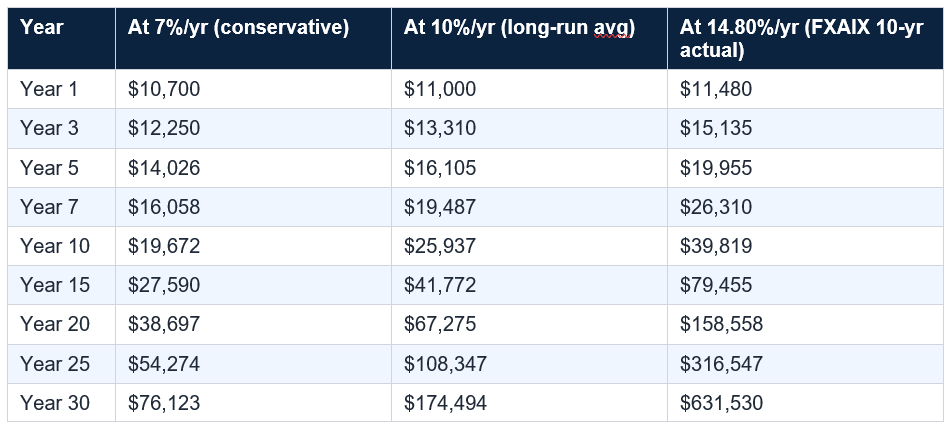
FXAIX expense ratio: 0.015%. Annual cost on $10,000: $1.50. These projections assume the stated annual return persists each year — actual returns are volatile. FV = $10,000 × (1+r)^n. Not investment advice. Past performance does not predict future results.
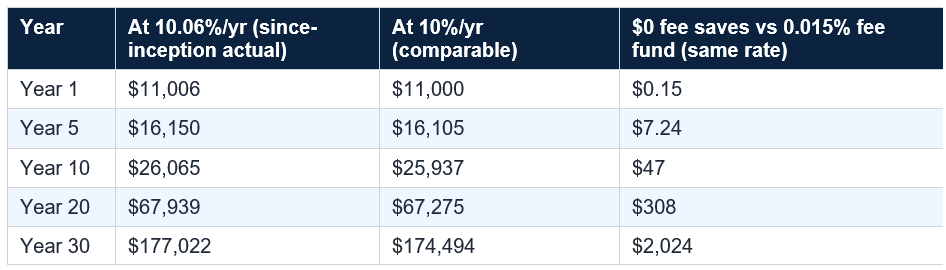
Note: the fee saving column compares FZROX (0.00%) against an equivalent FXAIX-style fund (0.015%) at the same underlying 10% return rate. The saving is genuine but small: $2,024 over 30 years on a $10,000 investment. The bigger saving is versus industry average funds at 0.85%. At 0.85% drag, the 30-year cost on $10,000 at 10% base return is approximately $18,900 in foregone compound wealth. Not investment advice.
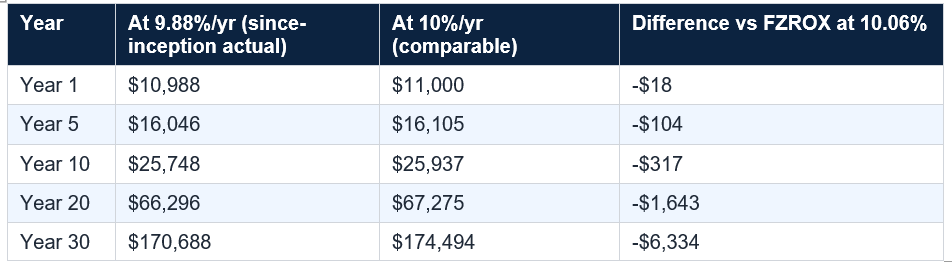
The $6,334 difference between FSKAX and FZROX over 30 years is due to the 0.18% annual return differential since their common inception period, not the $1.50 fee. FSKAX’s portability advantage may well be worth more than $6,334 to an investor who changes brokers. Not investment advice.
10. The Combined Portfolio: $3,333 in Each Fund
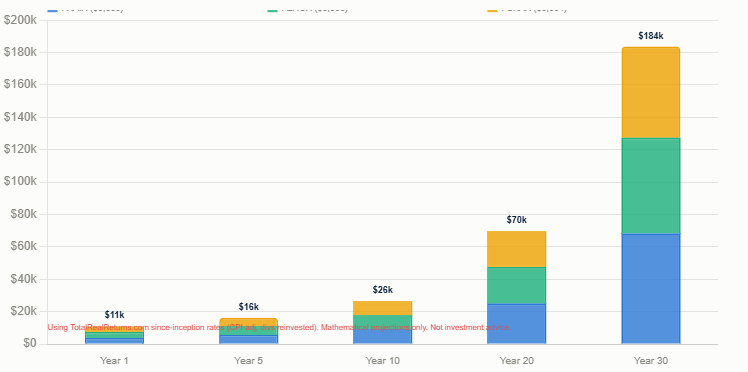
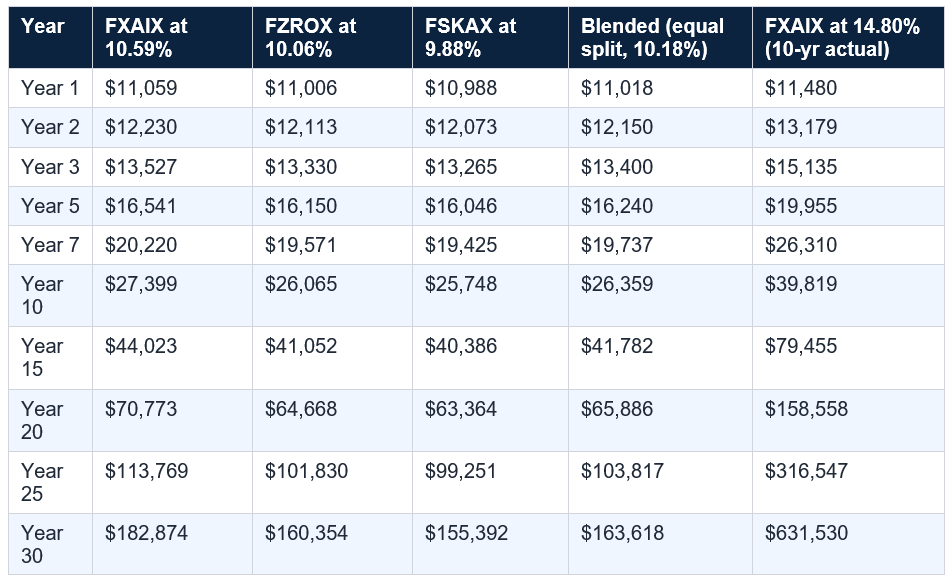
If you invest $10,000 split as $3,333 in FXAIX, $3,333 in FZROX, and $3,334 in FSKAX, the blended portfolio behaves close to a total US equity market exposure with a slight large-cap tilt from the FXAIX weight. The effective blended rate, using each fund’s since-FZROX-inception rate weighted equally, is approximately (10.59% + 10.06% + 9.88%) / 3 = 10.18% per year.
The Maths: $10,000 split $3,333/$3,333/$3,334 (FXAIX/FZROX/FSKAX) at blended rate 10.18%/yr (TotalRealReturns.com since-inception rates): Year 1: $11,018 | Year 5: $16,240 | Year 10: $26,359 | Year 20: $69,479 | Year 30: $183,170. Total annual cost: 2/3 of 0.015% + 1/3 of 0.00% = 0.010% = $1.00/yr on $10,000. Blended cost is effectively free. Note: these three funds share significant large-cap US equity exposure; the portfolio is not diversified across asset classes. Genuine diversification would require international and bond components. FV = $3,333 x (1+r1)^n + $3,333 x (1+r2)^n + $3,334 x (1+r3)^n. Not investment advice.
11. The Full 30-Year Growth Table: All Three Funds
The table below shows the complete 30-year compound growth projection for $10,000 in each fund at each fund’s own since-inception return rate, plus the blended portfolio. All figures use FV = $10,000 × (1+r)^n. Not investment advice.
The answer is essentially yes, with a caveat: the overlap is so complete that owning both at equal weights behaves almost identically to owning one at double the weight. The performance differential since inception (0.18% per year) is smaller than the natural tracking variation you would see between different fund families tracking the same index. There is no diversification benefit from holding both FZROX and FSKAX simultaneously.
The better framing for a $10,000 portfolio that includes both is that you are giving yourself optionality: FZROX for the zero-fee advantage and FSKAX for the portability safety net. This is a reasonable approach for an investor who is not yet certain whether they will stay at Fidelity long-term. For an investor who knows they are a permanent Fidelity customer, simply choosing FZROX (zero fee, broad market) or FSKAX (portable, nearly as cheap) and combining it with FXAIX for the S&P 500 track record is a cleaner decision. Not investment advice.
For a genuinely diversified $10,000 Fidelity portfolio, consider the three-fund approach: FXAIX or FZROX (US equity, 60-70%), FZILX or FSGGX (international equity, 20-30%), and FXNAX (US total bond, 10-20%). All four zero-expense-ratio funds have 0.00% cost. The bond allocation reduces volatility; the international allocation reduces country concentration risk. Proportions depend on age, risk tolerance, and time horizon. Not investment advice. Consult a qualified financial adviser.
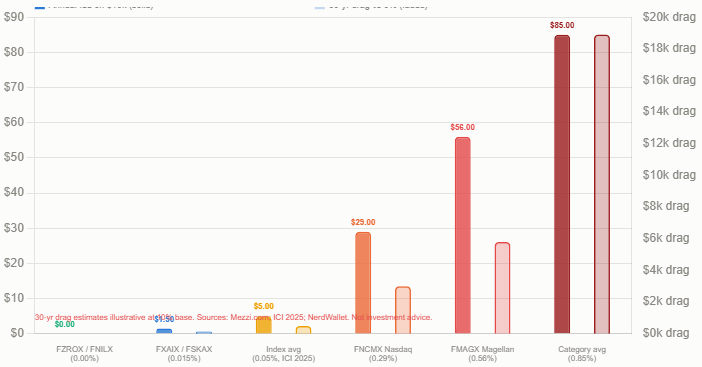
The Investment Company Institute’s 2025 data puts the average index fund expense ratio at 0.05%. Mezzi.com reports the industry category average at 0.85% (which includes active funds). On $10,000 at the category average of 0.85%, the annual fee is $85. Over 30 years at 10% base return, the total fee drag versus a 0.00% fund is approximately $18,900 in foregone compound wealth. This is the number that matters: not the $1.50 difference between FXAIX and FZROX, but the $18,900 difference between the Fidelity zero-cost lineup and the industry average.
The comparison becomes even more striking as portfolio size grows. At $100,000 invested (which a $10,000 initial investment might become in 15–20 years at strong growth rates), the annual fee difference between 0.00% and 0.85% is $850 per year. At $500,000, it is $4,250 per year. These are real ongoing costs that compound against you, year after year, making the choice of a low-cost fund at the start of an investment career potentially worth hundreds of thousands of dollars over a lifetime. Not investment advice.
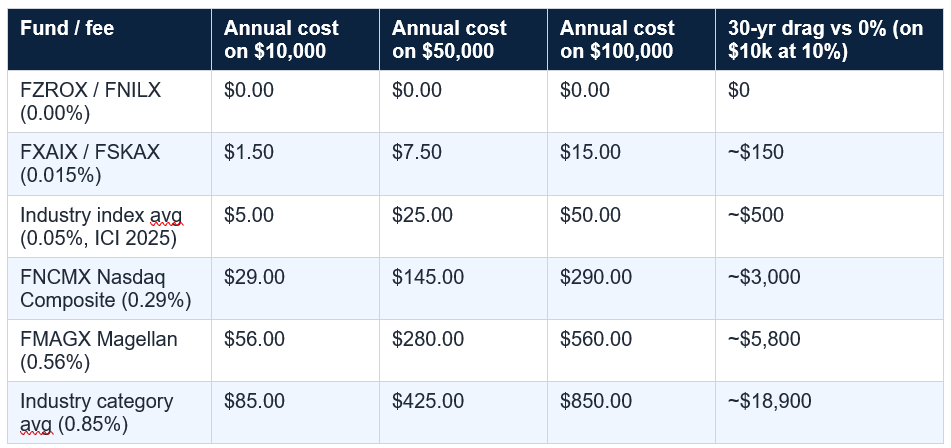
30-year drag figures are illustrative estimates at 10% base return. Actual fee impact depends on return sequence and contribution schedule. Sources: Mezzi.com; ICI 2025; NerdWallet. Not investment advice.
$10,000 invested in FXAIX once, at 10% per year, grows to approximately $174,494 after 30 years. $10,000 invested in FXAIX every year for 30 years at 10% per year grows to approximately $1,809,434. The difference — roughly $1.6 million — illustrates the mathematical reality that for most people, the size of the initial investment matters far less than the consistency of ongoing contributions. A $10,000 lump sum is a wonderful start; ten $10,000 investments over a decade is more powerful than any single-year number.
Dollar-cost averaging — the practice of investing a fixed amount at regular intervals regardless of market conditions — provides a behavioural advantage beyond the mathematical one. It removes the temptation to time the market (‘I’ll wait until prices fall a bit’), which academic research consistently shows destroys returns for individual investors. Setting up an automatic monthly transfer of $833 from a bank account into FXAIX or FZROX achieves the $10,000/year pace without requiring any monthly decision. Not investment advice.
But the more important conclusion is structural rather than numerical. These three funds cost almost nothing to own. They are available with no minimum investment. They require no expertise, no active management, no research, and no ongoing decisions beyond the initial purchase. The primary sources of return — the long-run growth of the US economy and its largest companies — are structural forces that have persisted through every recession, correction, and crisis of the past century. The investor’s only job is to stay invested, keep buying, and not sell when prices fall temporarily.
The $10,000 scenario is a starting point, not a destination. The investor who invests $10,000 once is better off than the one who invests nothing. The investor who adds $10,000 every year is dramatically better off still. The investor who starts today at any amount is better off than the one who waits. FXAIX, FZROX, and FSKAX are the vehicles. The discipline is the engine. Not financial advice. Consult a qualified independent financial adviser.
All three are excellent choices for a long-term $10,000 investment. The 'best' depends on your priorities: FXAIX (0.015%, S&P 500 track record since 2011, $740bn in assets, portable) is ideal if you want the classic benchmark with the longest Fidelity track record. FZROX (0.00%, free, Gold Medalist, broader total market) is ideal if you want the lowest possible cost and are committed to Fidelity for the long term. FSKAX (0.015%, portable, 3,700+ stocks, tracks public Dow Jones index) is ideal if you want total market breadth and the ability to transfer to another broker if needed. For most investors, the difference in outcomes across a $10,000 investment is minimal — the key is to choose one, invest, and stay invested. Not investment advice. Sources: Zacks; TotalRealReturns.com; Mezzi.com; NerdWallet.
How much will $10,000 be worth in 10 years in FXAIX?
Based on historical return scenarios (not forecasts): at FXAIX's 10-year actual annualised return of 14.80% (Zacks, December 31, 2025), $10,000 grows to approximately $39,819 in 10 years. At the S&P 500's long-run historical average of 10%/yr, approximately $25,937. At a conservative 7%, approximately $19,672. These are compound interest calculations (FV = $10,000 × (1.148)^10, etc.) and are not forecasts or guarantees. The S&P 500's 10-year return includes periods of both strong outperformance and extended underperformance. Past performance does not predict future results. Not investment advice.
Can I invest in FXAIX, FZROX, and FSKAX with just $10,000?
Yes. All three Fidelity index funds have a minimum investment of $1 (Fidelity's fractional shares feature means there is no traditional minimum). You can split $10,000 equally ($3,333 each) or in any proportion you choose. To access FZROX and FSKAX, you need a Fidelity account (brokerage, Roth IRA, traditional IRA, or 401(k) if Fidelity is your plan provider). FXAIX is also available at some other brokerages, but FZROX and FSKAX are Fidelity-centric products. The process: open a Fidelity account (fidelity.com), fund it with $10,000, and purchase shares in the desired amounts. Not investment advice.
Is FZROX really free? What's the catch?
FZROX has a genuine 0.00% expense ratio — no annual management fee. The 'catch' is that it uses a proprietary Fidelity index (the Fidelity U.S. Total Market Index) rather than a standard index like the S&P 500 or CRSP, and as a result, the zero-fee share class cannot be transferred in-kind to another broker. If you leave Fidelity, you must sell FZROX (a taxable event in a non-sheltered account) rather than simply transferring shares. For investors committed to Fidelity or holding FZROX inside a Roth IRA (where a sale is tax-free), this is manageable. Mezzi.com notes that $100,000 in FZROX over 30 years at 5% return accumulates $5,034 more than a comparable 0.04% fund due to the fee saving. Sources: Mezzi.com; NerdWallet (June 2026). Not investment advice.
Should I invest $10,000 all at once or spread it over time?
Academically, lump-sum investing outperforms dollar-cost averaging (DCA) approximately two-thirds of the time, because markets rise more often than they fall and a lump sum is exposed to more of the upside immediately (Vanguard research; various academic studies). However, DCA has a significant behavioural advantage: it removes the psychological burden of investing 'at the wrong time' and reduces the emotional impact of short-term market volatility. For a $10,000 first investment, the practical difference over 30 years between lump-sum and DCA over 12 months is unlikely to be material. The more important action is to invest and to keep investing regularly. Not investment advice. Consult a qualified financial adviser.
Table of Contents
- Why $10,000 and Why These Three Funds
- Fund One: FXAIX — The S&P 500 Core Holding
- Fund Two: FZROX — The Free Total Market Fund
- Fund Three: FSKAX — The Portable Total Market Fund
- How the Three Funds Compare: Side by Side
- Splitting $10,000 Three Ways: The Equal Allocation
- What $10,000 in FXAIX Grows to: Year by Year
- What $10,000 in FZROX Grows to: Year by Year
- What $10,000 in FSKAX Grows to: Year by Year
- The Combined Portfolio: $3,333 in Each Fund
- The Full 30-Year Growth Table: All Three Funds
- Why FZROX and FSKAX Overlap (And Why That Is Fine)
- The Fee Drag: What the $1.50/Year Difference Costs You
- The $10,000 Vs $10,000/Year Comparison
- The Realistic Caveats: What These Numbers Do Not Show
- Conclusion: The Best Move With $10,000 Is the Move You Make
- Frequently Asked Questions
$10k growth — all three funds, all scenarios
$3,333 each — the combined portfolio breakdown
Fee drag — what 0.015% vs 0.85% costs over time
Why $10,000 and Why These Three Funds
$10,000 is not an arbitrary starting point. It is the amount that sits in millions of savings accounts earning near-nothing. It is the sum that feels too small for a financial adviser and too large to spend without thinking about it. It is, in the words of a thousand personal finance articles, enough to start. And the question of what to do with it — specifically at Fidelity, specifically in low-cost index funds — is the most practical investment question of 2026 for a wide swath of the investing population.Fidelity manages over $17 trillion in assets under administration (Mezzi.com, 2026). Its index fund lineup includes FXAIX (the S&P 500 tracker with a 10-year return of +14.80% per year and a $740 billion asset base), FZROX (the zero-expense-ratio total market fund that charges literally nothing to own), and FSKAX (the portable total market fund tracking the Dow Jones U.S. Total Stock Market Index across 3,700+ US companies). These three funds represent the core of what Fidelity does best: broad US market exposure at the lowest possible cost, available with no minimum investment through fractional shares.
The three funds were chosen because they consistently appear on every credible list of best Fidelity index funds, because their combined characteristics (the S&P 500’s track record, the total market’s breadth, and the zero-fee advantage) represent three slightly different investment philosophies in the US equity space, and because the comparison between them is instructive in ways that go beyond just the headline return number. This article models $10,000 in each fund separately and split equally, at multiple return rate scenarios, over 1, 5, 10, 20, and 30 years. Not financial advice.
Fidelity AUM: $17 trillion+ (Mezzi.com 2026). FXAIX net assets: ~$740bn; 10-yr return +14.80%/yr; expense ratio 0.015% ($1.50/yr on $10k). FZROX 1-yr +17.77%; since-inception +10.06%/yr; expense ratio 0.00% ($0/yr). FSKAX 3,700+ stocks; since-inception +9.88%/yr; expense ratio 0.015% ($1.50/yr on $10k). Minimum investment in all three: $1 (fractional shares). $10,000 at 10%/yr for 30 years: ~$174,494. $10,000 at 14.80%/yr (FXAIX 10-yr actual) for 30 years: ~$631,530. Sources: Mezzi.com; TotalRealReturns.com; Zacks; NerdWallet. Not investment advice.
Fund One: FXAIX — The S&P 500 Core Holding
FXAIX is the flagship of Fidelity’s index fund lineup and the most widely held fund in the firm’s universe by asset size. It tracks the S&P 500 Index, which measures the performance of the 500 largest publicly traded US companies weighted by market capitalisation. At any given time, the top 10 holdings in FXAIX account for roughly 30–35% of the fund, dominated by companies including Microsoft, Apple, Nvidia, Amazon, and Alphabet. Owning FXAIX means owning fractional interests in all of them, and the approximately 490 other large US companies, in one single purchase.The expense ratio is 0.015% per year. On $10,000, that is $1.50 annually — the price of a gas station coffee to own a piece of America’s 500 largest corporations for an entire year. The 10-year annualised return to December 31, 2025 is +14.80% per year (Zacks). The 3-year is +22.99%. The 5-year is +14.41%. Since inception in May 2011, the fund has returned +13.89% per year. In Morningstar’s database, FXAIX ranks in the 2nd percentile of its category over 10 years — outperforming 98% of comparable funds, almost entirely because its near-zero expense ratio allows it to track the market without compounding fee drag into the return.
$10,000 invested in FXAIX at its 10-year actual return of 14.80% per year grows to approximately $19,955 in 5 years, $39,819 in 10 years, $158,558 in 20 years, and $631,530 in 30 years. At the more conservative long-run S&P 500 average of 10% per year, the same $10,000 grows to $16,105 in 5 years, $25,937 in 10 years, $67,275 in 20 years, and $174,494 in 30 years. The enormous difference between the 10% and 14.80% scenarios over 30 years ($174,494 vs $631,530) illustrates the compounding power of even a few percentage points of annual return difference sustained over decades. Not investment advice.
FXAIX — Fidelity 500 Index Fund: Expense ratio: 0.015% ($1.50/yr on $10k). Tracks: S&P 500 (500 largest US companies). Net assets: ~$740bn. Minimum investment: $1. 1-year return (to Jun 29 2026): +16.99%. 3-year: +22.99%. 5-year: +14.41%. 10-year: +14.80%. Since inception (May 2011): +13.89%. $10,000 at 14.80% for 10 yrs: ~$39,819. $10,000 at 10% for 10 yrs: ~$25,937. Morningstar: 2nd percentile in category, 10-yr. Portable: yes (available at multiple brokers). Sources: Zacks Dec 31 2025; TotalRealReturns.com; NerdWallet. Not investment advice.
Fund Two: FZROX — The Free Total Market Fund
FZROX was a genuine disruption to the index fund industry when Fidelity launched it in August 2018. A mutual fund with a 0.00% expense ratio — no management fee, no annual charge, completely free to own as long as you hold it at Fidelity. The mechanism: Fidelity constructed a proprietary index (the Fidelity U.S. Total Market Index) to avoid paying licensing fees to index providers like S&P or CRSP, allowing it to pass on the entire cost saving to the investor. Eight years after its launch, only Fidelity and E*TRADE offer true zero-expense-ratio index funds (NerdWallet, June 2026).FZROX holds approximately 2,600 US stocks, covering large, mid, and small-cap companies. On $10,000 invested, the annual cost is exactly $0.00. Since its August 2018 inception through June 2026, FZROX has returned +10.06% per year in total (+112.95% cumulative, TotalRealReturns.com). Its 1-year return to June 29, 2026 is +17.77%; its 3-year annualised return is +16.83%; its 5-year is +7.65%. Morningstar rates it a Gold Medalist with a 3-star overall rating. $10,000 invested in FZROX at its since-inception rate of 10.06% per year grows to approximately $16,150 in 5 years, $26,065 in 10 years, $67,939 in 20 years, and $177,022 in 30 years.
The one significant caveat for FZROX is portability. Because it uses a proprietary Fidelity index, the zero-fee share class cannot be transferred to another broker in kind. If you decide to move your account from Fidelity to Vanguard or Schwab, you would need to sell your FZROX position first — triggering a taxable capital gain in a non-sheltered account — and reinvest at the new broker. For investors committed to Fidelity for the long term, and particularly for those holding FZROX inside a Roth IRA (where the sale would be tax-free), this is a manageable consideration. For investors who might switch platforms, FSKAX’s portability may be worth the $1.50 per year cost difference.
FZROX — Fidelity ZERO Total Market Index Fund: Expense ratio: 0.00% ($0/yr on $10k). Tracks: Fidelity U.S. Total Market Index (proprietary). Holdings: ~2,600 US stocks. Minimum investment: $1. 1-year return (to Jun 29 2026): +17.77%. 3-year: +16.83%/yr. 5-year: +7.65%/yr. Since inception (Aug 2018): +10.06%/yr (+112.95% total). $10,000 at 10.06% for 10 yrs: ~$26,065. Morningstar: Gold Medalist, 3-star. CAVEAT: Fidelity-only; proprietary index; not transferable in-kind to other brokers. Sources: Mezzi.com; TotalRealReturns.com; NerdWallet. Not investment advice.
Fund Three: FSKAX — The Portable Total Market Fund
FSKAX occupies a specific niche in the Fidelity lineup: it does almost everything FZROX does, but with a $1.50 per year annual cost on $10,000 and the significant advantage of tracking a public, portable index. Where FZROX tracks Fidelity’s proprietary index, FSKAX tracks the Dow Jones U.S. Total Stock Market Index — a standard public benchmark that Fidelity licences, and which means FSKAX can be transferred to another broker if you ever decide to move. For most long-term investors sitting comfortably inside the Fidelity ecosystem, this distinction is abstract. For investors who value optionality, it is meaningful.FSKAX holds over 3,700 US stocks (compared to FZROX’s approximately 2,600), making it technically the most broadly diversified US equity fund of the three. The additional 1,100+ stocks relative to FZROX are primarily very small companies — micro-cap and nano-cap stocks that individually represent tiny weights in the fund. In practice, the difference in performance between FSKAX and FZROX is negligible over most time horizons: from August 2018 to June 2026, FSKAX returned +9.88% per year versus FZROX’s +10.06% — a difference of 0.18% per year, which is entirely consistent with normal tracking variation rather than a fundamental difference in investment quality.
$10,000 invested in FSKAX at its since-inception rate of 9.88% per year grows to approximately $16,046 in 5 years, $25,748 in 10 years, $66,296 in 20 years, and $170,688 in 30 years. These figures are virtually indistinguishable from the FZROX projections at a similar rate, which is the point: for a buy-and-hold investor who never leaves Fidelity, the choice between FZROX and FSKAX is largely philosophical. Not investment advice.
How the Three Funds Compare: Side by Side
Splitting $10,000 Three Ways: The Equal Allocation
The most natural way to invest $10,000 across three funds is to split it equally: $3,333 in FXAIX, $3,333 in FZROX, and $3,334 in FSKAX. This immediately raises a legitimate question: since FZROX and FSKAX are both US total market funds, and FXAIX is the US large-cap fund (whose top holdings dominate the total market funds), is this portfolio three funds or effectively one fund three times?The overlap is real. FXAIX’s holdings are almost entirely contained within both FZROX and FSKAX. The 500 S&P 500 companies are the largest components of both total market funds. Splitting $10,000 equally across these three funds does not provide meaningful diversification within US equities — it is closer to a single large-cap US equity exposure, with modest incremental weights on mid- and small-cap US companies from the two total market funds.
That said, there is a practical case for the equal split, particularly for a $10,000 first investment. It allows an investor to get real-money experience with all three funds, observe how they behave differently during different market conditions (large-cap vs total market performance diverges in some years), and decide over time which allocation they prefer before committing a larger sum to one fund. The scenario-modelling value is genuine even if the diversification benefit is modest.
A more genuinely diversified $10,000 Fidelity allocation might include one of the three US equity funds (say $5,000 in FXAIX), an international fund (say $3,000 in FZILX — Fidelity ZERO International Index Fund, 0.00% expense ratio), and a bond fund (say $2,000 in FXNAX — Fidelity ZERO Total Bond Index Fund, 0.00% expense ratio). This three-fund portfolio approach provides genuine asset-class diversification. Not investment advice.
What $10,000 in FXAIX Grows to: Year by Year
The compound growth of $10,000 in FXAIX, modelled at three return rate scenarios (conservative 7%, long-run average 10%, and FXAIX’s actual 10-year rate of 14.80%) shows the full range of plausible outcomes. The most important observation is that the most likely outcome — the one that history suggests is most defensible to assume — lies closer to the 10% column than the 14.80% column, because the decade ending 2025 was unusually strong for US large-cap equities.FXAIX expense ratio: 0.015%. Annual cost on $10,000: $1.50. These projections assume the stated annual return persists each year — actual returns are volatile. FV = $10,000 × (1+r)^n. Not investment advice. Past performance does not predict future results.
What $10,000 in FZROX Grows to: Year by Year
FZROX’s zero-expense-ratio advantage is most visible in the long-run comparison against funds with similar returns but higher fees. At the same 10% return rate, FZROX produces marginally more than a fund charging 0.015% — a difference of $1.50 per year on $10,000 that barely registers over 10 years but compounds slightly over 30. The more meaningful comparison is FZROX at 10% versus an industry average fund at 9.15% (the 10% return minus 0.85% fee): the fee drag on that average fund costs approximately $7,700 extra over 30 years on a $10,000 investment.Note: the fee saving column compares FZROX (0.00%) against an equivalent FXAIX-style fund (0.015%) at the same underlying 10% return rate. The saving is genuine but small: $2,024 over 30 years on a $10,000 investment. The bigger saving is versus industry average funds at 0.85%. At 0.85% drag, the 30-year cost on $10,000 at 10% base return is approximately $18,900 in foregone compound wealth. Not investment advice.
What $10,000 in FSKAX Grows to: Year by Year
FSKAX is the closest practical equivalent to FZROX for investors who prioritise portability. Its performance since inception tracks within 0.18% per year of FZROX, its expense ratio is 0.015%, and its holdings are slightly broader at 3,700+ stocks. For a $10,000 investment over 30 years, the difference between FSKAX and FZROX at their respective since-inception return rates is approximately $6,334 ($177,022 vs $170,688). That difference is entirely explained by the 0.18% annual return differential, not by the $1.50 annual fee difference.The $6,334 difference between FSKAX and FZROX over 30 years is due to the 0.18% annual return differential since their common inception period, not the $1.50 fee. FSKAX’s portability advantage may well be worth more than $6,334 to an investor who changes brokers. Not investment advice.
10. The Combined Portfolio: $3,333 in Each Fund
If you invest $10,000 split as $3,333 in FXAIX, $3,333 in FZROX, and $3,334 in FSKAX, the blended portfolio behaves close to a total US equity market exposure with a slight large-cap tilt from the FXAIX weight. The effective blended rate, using each fund’s since-FZROX-inception rate weighted equally, is approximately (10.59% + 10.06% + 9.88%) / 3 = 10.18% per year.
The Maths: $10,000 split $3,333/$3,333/$3,334 (FXAIX/FZROX/FSKAX) at blended rate 10.18%/yr (TotalRealReturns.com since-inception rates): Year 1: $11,018 | Year 5: $16,240 | Year 10: $26,359 | Year 20: $69,479 | Year 30: $183,170. Total annual cost: 2/3 of 0.015% + 1/3 of 0.00% = 0.010% = $1.00/yr on $10,000. Blended cost is effectively free. Note: these three funds share significant large-cap US equity exposure; the portfolio is not diversified across asset classes. Genuine diversification would require international and bond components. FV = $3,333 x (1+r1)^n + $3,333 x (1+r2)^n + $3,334 x (1+r3)^n. Not investment advice.
11. The Full 30-Year Growth Table: All Three Funds
The table below shows the complete 30-year compound growth projection for $10,000 in each fund at each fund’s own since-inception return rate, plus the blended portfolio. All figures use FV = $10,000 × (1+r)^n. Not investment advice.
Why FZROX and FSKAX Overlap (And Why That Is Fine)
FZROX and FSKAX are both US total market funds. They hold many of the same stocks. FZROX holds approximately 2,600 and FSKAX holds approximately 3,700, with the additional 1,100 in FSKAX being very small companies with negligible individual weights. A common investor concern is whether holding both FZROX and FSKAX is redundant — effectively owning the same thing twice.The answer is essentially yes, with a caveat: the overlap is so complete that owning both at equal weights behaves almost identically to owning one at double the weight. The performance differential since inception (0.18% per year) is smaller than the natural tracking variation you would see between different fund families tracking the same index. There is no diversification benefit from holding both FZROX and FSKAX simultaneously.
The better framing for a $10,000 portfolio that includes both is that you are giving yourself optionality: FZROX for the zero-fee advantage and FSKAX for the portability safety net. This is a reasonable approach for an investor who is not yet certain whether they will stay at Fidelity long-term. For an investor who knows they are a permanent Fidelity customer, simply choosing FZROX (zero fee, broad market) or FSKAX (portable, nearly as cheap) and combining it with FXAIX for the S&P 500 track record is a cleaner decision. Not investment advice.
For a genuinely diversified $10,000 Fidelity portfolio, consider the three-fund approach: FXAIX or FZROX (US equity, 60-70%), FZILX or FSGGX (international equity, 20-30%), and FXNAX (US total bond, 10-20%). All four zero-expense-ratio funds have 0.00% cost. The bond allocation reduces volatility; the international allocation reduces country concentration risk. Proportions depend on age, risk tolerance, and time horizon. Not investment advice. Consult a qualified financial adviser.
The Fee Drag: What the $1.50/Year Difference Costs You
On $10,000, the difference between FZROX’s 0.00% and FXAIX’s 0.015% is $1.50 per year. This is genuinely trivial for any practical financial purpose. Over 30 years of compound growth on a $10,000 investment, the fee drag from 0.015% relative to 0.00% at 10% annual return is approximately $150 — or $5 per year. The fee comparison that actually matters is between Fidelity’s entire lineup and the rest of the industry.The Investment Company Institute’s 2025 data puts the average index fund expense ratio at 0.05%. Mezzi.com reports the industry category average at 0.85% (which includes active funds). On $10,000 at the category average of 0.85%, the annual fee is $85. Over 30 years at 10% base return, the total fee drag versus a 0.00% fund is approximately $18,900 in foregone compound wealth. This is the number that matters: not the $1.50 difference between FXAIX and FZROX, but the $18,900 difference between the Fidelity zero-cost lineup and the industry average.
The comparison becomes even more striking as portfolio size grows. At $100,000 invested (which a $10,000 initial investment might become in 15–20 years at strong growth rates), the annual fee difference between 0.00% and 0.85% is $850 per year. At $500,000, it is $4,250 per year. These are real ongoing costs that compound against you, year after year, making the choice of a low-cost fund at the start of an investment career potentially worth hundreds of thousands of dollars over a lifetime. Not investment advice.
30-year drag figures are illustrative estimates at 10% base return. Actual fee impact depends on return sequence and contribution schedule. Sources: Mezzi.com; ICI 2025; NerdWallet. Not investment advice.
The $10,000 vs $10,000/Year Comparison
The single most important context for any discussion of a $10,000 lump sum investment is the comparison with what happens if that $10,000 becomes an annual habit. The lump sum has compounding working for it from day one. The annual contribution has compounding working on a growing base, and benefits from dollar-cost averaging across different market conditions.$10,000 invested in FXAIX once, at 10% per year, grows to approximately $174,494 after 30 years. $10,000 invested in FXAIX every year for 30 years at 10% per year grows to approximately $1,809,434. The difference — roughly $1.6 million — illustrates the mathematical reality that for most people, the size of the initial investment matters far less than the consistency of ongoing contributions. A $10,000 lump sum is a wonderful start; ten $10,000 investments over a decade is more powerful than any single-year number.
Dollar-cost averaging — the practice of investing a fixed amount at regular intervals regardless of market conditions — provides a behavioural advantage beyond the mathematical one. It removes the temptation to time the market (‘I’ll wait until prices fall a bit’), which academic research consistently shows destroys returns for individual investors. Setting up an automatic monthly transfer of $833 from a bank account into FXAIX or FZROX achieves the $10,000/year pace without requiring any monthly decision. Not investment advice.
The Realistic Caveats: What These Numbers Do Not Show
The compound growth tables in this article are illustrations of what happens when a constant annual return is applied to a starting investment. They are not predictions. The gap between these smooth projections and real market experience is wide, and understanding that gap is as important as understanding the projections themselves.- Sequence of returns: the S&P 500 fell -33.75% from peak to trough in the COVID crash of 2020 (TotalRealReturns.com, FXAIX data). An investor who sold at the bottom in March 2020 did not participate in the subsequent recovery. The compound growth tables assume you stay invested through every drawdown, which is emotionally harder than it sounds.
- Return variability: FXAIX’s quarterly returns in 2025 were -4.27% (Q1), +10.94% (Q2), +8.12% (Q3), +2.65% (Q4) (Zacks). The annual total was +17.86%, but the journey included a frightening quarter-one correction. A 10% or 14.80% annual average is composed of highly variable quarters and years.
- The 10-year return context: FXAIX’s 14.80% 10-year actual return reflects one of the strongest decades for US large-cap equities in history. The decade 2000–2009 saw the S&P 500 finish lower than it started. Using 14.80% as a 30-year projection is optimistic; using 10% (the long-run average since 1926) is more defensible.
- Tax treatment: in a taxable account, dividends (FXAIX yield approximately 1.11%) are taxable each year. Capital gains are taxed when shares are sold. In a Roth IRA, none of this applies — all growth is permanently tax-free. The after-tax terminal value in a taxable account is meaningfully lower than the gross projections shown here.
- Inflation: all returns shown are nominal. Inflation reduces purchasing power. TotalRealReturns.com’s CPI-adjusted data shows FXAIX’s 10-year real return at +11.81% per year (versus +14.80% nominal). Real returns are the numbers that matter for retirement planning.
Conclusion
If you invest $10,000 equally across FXAIX, FZROX, and FSKAX — $3,333 in each — you will own fractional interests in effectively the entire US equity market at a blended expense ratio of approximately 0.010% per year, or $1 annually on your $10,000. The compound growth projections at the long-run 10% average rate suggest you will have approximately $26,000 in 10 years, $66,000 in 20 years, and $163,000 in 30 years. At FXAIX’s actual 10-year return of 14.80%, those figures become $40,000, $159,000, and $632,000 from FXAIX alone.But the more important conclusion is structural rather than numerical. These three funds cost almost nothing to own. They are available with no minimum investment. They require no expertise, no active management, no research, and no ongoing decisions beyond the initial purchase. The primary sources of return — the long-run growth of the US economy and its largest companies — are structural forces that have persisted through every recession, correction, and crisis of the past century. The investor’s only job is to stay invested, keep buying, and not sell when prices fall temporarily.
The $10,000 scenario is a starting point, not a destination. The investor who invests $10,000 once is better off than the one who invests nothing. The investor who adds $10,000 every year is dramatically better off still. The investor who starts today at any amount is better off than the one who waits. FXAIX, FZROX, and FSKAX are the vehicles. The discipline is the engine. Not financial advice. Consult a qualified independent financial adviser.
Frequently Asked Questions
Which of the three funds — FXAIX, FZROX, or FSKAX — is the best for $10,000?All three are excellent choices for a long-term $10,000 investment. The 'best' depends on your priorities: FXAIX (0.015%, S&P 500 track record since 2011, $740bn in assets, portable) is ideal if you want the classic benchmark with the longest Fidelity track record. FZROX (0.00%, free, Gold Medalist, broader total market) is ideal if you want the lowest possible cost and are committed to Fidelity for the long term. FSKAX (0.015%, portable, 3,700+ stocks, tracks public Dow Jones index) is ideal if you want total market breadth and the ability to transfer to another broker if needed. For most investors, the difference in outcomes across a $10,000 investment is minimal — the key is to choose one, invest, and stay invested. Not investment advice. Sources: Zacks; TotalRealReturns.com; Mezzi.com; NerdWallet.
How much will $10,000 be worth in 10 years in FXAIX?
Based on historical return scenarios (not forecasts): at FXAIX's 10-year actual annualised return of 14.80% (Zacks, December 31, 2025), $10,000 grows to approximately $39,819 in 10 years. At the S&P 500's long-run historical average of 10%/yr, approximately $25,937. At a conservative 7%, approximately $19,672. These are compound interest calculations (FV = $10,000 × (1.148)^10, etc.) and are not forecasts or guarantees. The S&P 500's 10-year return includes periods of both strong outperformance and extended underperformance. Past performance does not predict future results. Not investment advice.
Can I invest in FXAIX, FZROX, and FSKAX with just $10,000?
Yes. All three Fidelity index funds have a minimum investment of $1 (Fidelity's fractional shares feature means there is no traditional minimum). You can split $10,000 equally ($3,333 each) or in any proportion you choose. To access FZROX and FSKAX, you need a Fidelity account (brokerage, Roth IRA, traditional IRA, or 401(k) if Fidelity is your plan provider). FXAIX is also available at some other brokerages, but FZROX and FSKAX are Fidelity-centric products. The process: open a Fidelity account (fidelity.com), fund it with $10,000, and purchase shares in the desired amounts. Not investment advice.
Is FZROX really free? What's the catch?
FZROX has a genuine 0.00% expense ratio — no annual management fee. The 'catch' is that it uses a proprietary Fidelity index (the Fidelity U.S. Total Market Index) rather than a standard index like the S&P 500 or CRSP, and as a result, the zero-fee share class cannot be transferred in-kind to another broker. If you leave Fidelity, you must sell FZROX (a taxable event in a non-sheltered account) rather than simply transferring shares. For investors committed to Fidelity or holding FZROX inside a Roth IRA (where a sale is tax-free), this is manageable. Mezzi.com notes that $100,000 in FZROX over 30 years at 5% return accumulates $5,034 more than a comparable 0.04% fund due to the fee saving. Sources: Mezzi.com; NerdWallet (June 2026). Not investment advice.
Should I invest $10,000 all at once or spread it over time?
Academically, lump-sum investing outperforms dollar-cost averaging (DCA) approximately two-thirds of the time, because markets rise more often than they fall and a lump sum is exposed to more of the upside immediately (Vanguard research; various academic studies). However, DCA has a significant behavioural advantage: it removes the psychological burden of investing 'at the wrong time' and reduces the emotional impact of short-term market volatility. For a $10,000 first investment, the practical difference over 30 years between lump-sum and DCA over 12 months is unlikely to be material. The more important action is to invest and to keep investing regularly. Not investment advice. Consult a qualified financial adviser.

0 Comments Comments