
Investing
What Is Backtesting in Trading? Trading Expert Explains


Table of Contents
- The Flight Simulator That Could Save Your Trading Account
- What Is Backtesting in Trading?
- Why Backtest? The Four Core Benefits
- The Seven Key Backtesting Metrics Every Trader Must Understand
- Manual vs Automated Backtesting: Which Is Right for You?
- How to Backtest a Trading Strategy: The Six-Step Process
- Worked Example: Backtesting a 20-Day SMA Pullback Strategy
- The Four Critical Backtesting Limitations Every Trader Must Know
- Backtesting vs Forward Testing (Paper Trading)
- Conclusion
- Frequently Asked Questions (FAQ)
The Flight Simulator That Could Save Your Trading Account
You have a trading idea. You have seen it work on the charts a handful of times. You are confident enough to start trading it with real money. This is the moment that separates traders who test their ideas from traders who pay the market for an education. The instinct to trade what 'looks good' on a chart — based on three, five, or even ten examples — is one of the most expensive habits in retail trading. A coin flip can land heads eight times out of ten. That does not mean the coin is biased. It means ten flips is not enough data to know. The same principle applies to trading strategies.Backtesting is the process of applying your trading strategy to historical market data to find out — before risking a single pound or dollar — whether it has a real statistical edge or whether the patterns you noticed were simply luck in a small sample. QuantifiedStrategies describes it precisely: 'Backtesting means applying a set of trading rules to historical market data to estimate how those rules would have performed in the past. Think of it as a flight simulator for traders. Instead of risking real capital on an untested idea, you run your strategy through years of price data to see what would have happened.' TradeZella's updated July 2026 guide reinforces the practical stakes: 'A strategy with no historical edge has no basis for live trading. You're guessing. A strategy with a documented edge across multiple market conditions gives you a foundation to build on.'
This guide covers backtesting comprehensively for 2026: the definition and core purpose, the difference between manual bar replay and automated algorithmic backtesting, the seven key performance metrics every backtest should produce, the step-by-step process for conducting a reliable backtest, a worked example of a simple moving average pullback strategy backtest, the critical limitations including overfitting and lookahead bias, the distinction between backtesting and forward testing, and the tools available to traders in 2026 for both manual and automated approaches. By the end, you will understand not just what backtesting is, but how to conduct one that actually produces trustworthy conclusions about whether your trading strategy is worth trading live.
What Is Backtesting in Trading?
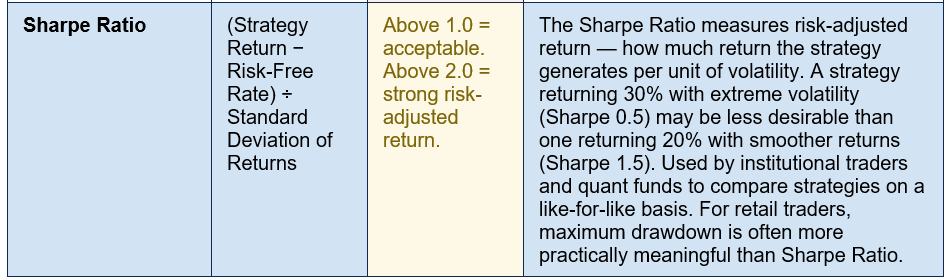
Backtesting is the process of applying a defined set of trading rules — including entry criteria, exit criteria, position sizing, and risk parameters — to historical market price data to measure how those rules would have performed if applied systematically in the past. ElTraderFinanciado's April 2026 guide frames it with the most intuitive metaphor: 'It's like a time machine for your strategy: you go back weeks, months, or years and execute your plan just as you would in real time.'The output of a backtest is a simulated trade log — every trade the strategy would have taken during the test period, with entry price, exit price, profit or loss, and the date and time of each transaction. From this log, a set of performance metrics are calculated: win rate, profit factor, expectancy, maximum drawdown, Sharpe ratio, and R-multiple distribution. These metrics collectively answer the core question every trader needs to answer before going live: does this strategy have a statistically reliable edge, or does it simply look good on the limited charts I have seen?
TradeZella's guide (July 2026) makes the distinction between edge and luck quantitative: 'If your strategy consists of buying when price retests the previous day's point of control with a bullish pin bar, backtesting allows you to review the last 6 months of sessions, find every time that condition was met, and record the result. After 100+ simulated trades, you'll have concrete data on whether the strategy makes or loses money. It validates your edge. Without backtesting, you don't know if you have a real edge or if the 5 winning trades you saw were simply luck. The difference between a profitable trader and a losing one is often the difference between a strategy with a verified edge and one based on intuition.'
The goal of backtesting is not to predict the future with certainty. Market conditions change, volatility regimes shift, and a strategy that worked in 2022 may struggle in 2026. The goal is the narrower but achievable task of establishing whether the strategy has generated a statistically significant edge under historical conditions — and across a sufficiently wide range of market environments — to justify live trading. As QuantifiedStrategies states: 'Testing a strategy on S&P 500 data from 2000 to 2025 exposes it to the dot-com bust, the 2008 Global Financial Crisis, the 2020 COVID crash, and the post-2022 inflation volatility. This range of market conditions reveals how your trading system behaves when markets boom, crash, or drift sideways.'
Why sample size is non-negotiable: Minimum 50 trades for a basic read; 100+ for reliable conclusions. Under 30 trades — too noisy to draw any reliable conclusions. — TradeZella (July 10, 2026): 'A coin flip can land heads 8 out of 10 times. That does not mean the coin is biased. It means 10 flips is not enough to know. The same applies to trading strategies.' ElTraderFinanciado (April 30, 2026): '200 historical trades provides solid statistical confidence that a strategy has a real edge.' A high-frequency day trading strategy may generate 100 trades in two weeks; a swing trading strategy on daily charts may need 2-3 years of historical data to accumulate 100 trades
Why Backtest? The Four Core Benefits
- Validates your edge before risking real capital: The primary purpose. ElTraderFinanciado: 'Before risking a single dollar, you need to test your strategy with historical data. Backtesting lets you simulate hundreds of trades in the past to find out if your idea has a real statistical edge or if it's just an illusion.' A strategy that fails in backtesting on 200 historical trades would have cost the trader real money to discover in live trading. Backtesting converts that education from an expensive live experience into a free historical simulation.
- Produces statistical confidence in your rules: ElTraderFinanciado: 'If a strategy has worked consistently over 200 historical trades, there are solid reasons to believe it will continue working, as long as market conditions don't change radically.' Without statistical confidence from historical testing, a trader experiencing a drawdown cannot distinguish between normal variance within a profitable strategy and evidence that the strategy is fundamentally flawed. With a backtest, they know the expected maximum drawdown — and can assess whether the current loss streak is within historical norms or signals something more serious.
- Enforces rules-based, objective thinking: QuantifiedStrategies identifies this underrated benefit: 'Backtesting also enforces disciplined, rules-based trading.' The requirement to define entry and exit rules precisely enough that they can be tested is itself a valuable discipline. A trader who says 'I buy when the setup looks good' cannot backtest that strategy, because 'looks good' is not a measurable, repeatable condition. The act of defining rules precisely enough to test them forces the clarity of thinking that disciplined trading requires.
- Establishes drawdown expectations for risk management: TradeZella: 'If your backtest shows a 15% maximum drawdown, you know your drawdown management threshold needs to accommodate that.' Without backtesting, a trader has no benchmark for what a normal drawdown looks like in their strategy. With it, they know: if the strategy has historically recovered from 15% drawdowns, a current 12% drawdown is within normal variance and should not trigger strategy abandonment.
The Seven Key Backtesting Metrics Every Trader Must Understand
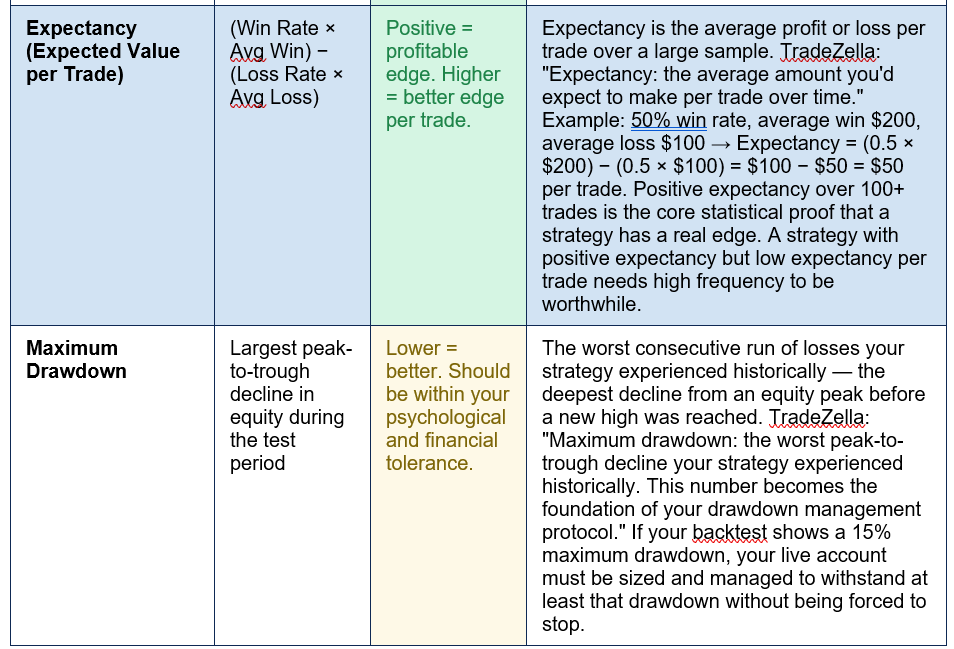
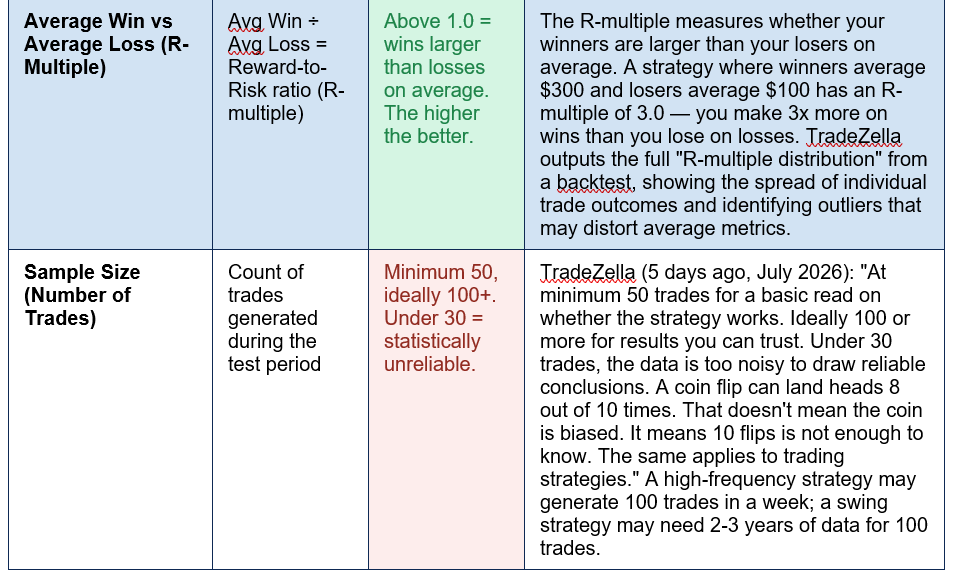
A backtest is only as useful as the metrics it produces. The seven performance metrics below are the core outputs that every backtest should generate — and that every trader should understand before deciding whether a strategy has a real edge: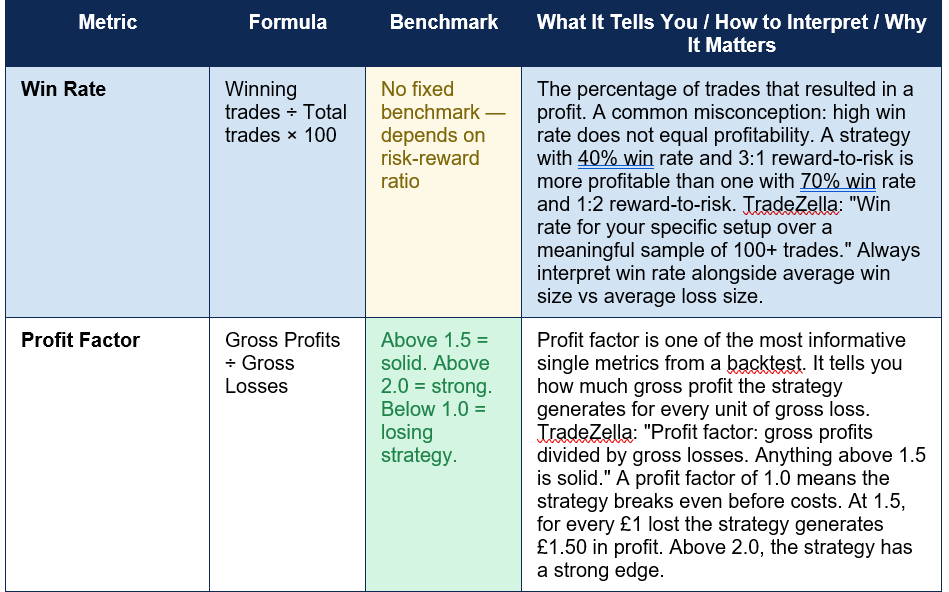
Manual vs Automated Backtesting: Which Is Right for You?
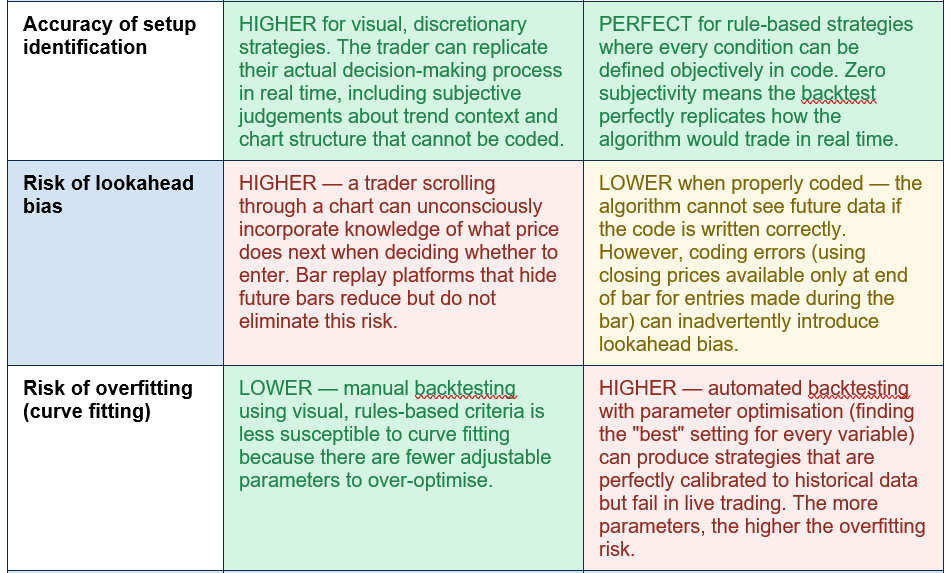
There are two fundamentally different approaches to backtesting, each with distinct advantages, limitations, and appropriate use cases. The right choice depends on your trading style — whether you are a discretionary trader who makes visual judgements or a systematic trader whose rules can be fully coded: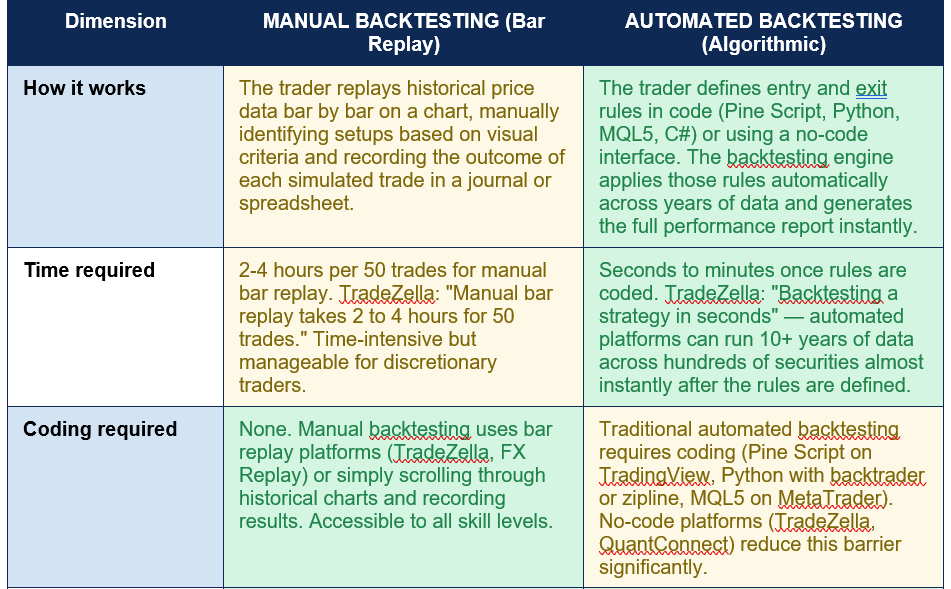

The no-code revolution in backtesting for 2026: One of the most significant developments in backtesting accessibility in recent years is the emergence of no-code automated backtesting platforms. TradeZella's July 2026 guide describes the capability: 'TradeZella automated no-code backtesting lets you describe your strategy rules in plain English and the engine runs them across years of data automatically — stocks, forex, futures, and crypto across 11+ years of data in one platform.' Previously, automated backtesting required proficiency in Pine Script (TradingView), Python (with libraries like backtrader or zipline), or MQL5 (MetaTrader) — all of which carry a significant learning curve for non-programmers. The ability to run comprehensive automated backtests without coding has dramatically lowered the barrier for retail traders to conduct rigorous strategy validation before going live.
How to Backtest a Trading Strategy: The Six-Step Process
- Define your strategy rules precisely and completely: TradeZella: 'Before you touch any data, write down your strategy in precise, repeatable rules. No ambiguity. Someone else should be able to read your rules and take the exact same trades you would.' This means defining: entry criteria (what specific conditions must be true to enter?), exit criteria (what conditions trigger a profit exit or stop loss exit?), position sizing (how many shares, lots, or contracts per trade?), and any filters (time of day, market conditions, minimum volume requirements). QuantifiedStrategies provides a concrete example: 'Entry: Price touches VWAP from above, RSI is below 30, volume is above the 20-period average, and the trade occurs between 9:30 and 11:00 AM EST.'
- Select the market, timeframe, and date range: Choose the instrument you trade (the specific equity, index, currency pair, or futures contract), the chart timeframe (5-minute for day trading, daily for swing trading), and the historical date range. QuantifiedStrategies recommends a range wide enough to include multiple different market conditions: 'Testing a strategy on S&P 500 data from 2000 to 2025 exposes it to the dot-com bust, the 2008 Global Financial Crisis, the 2020 COVID crash, and the post-2022 inflation volatility.' For manual bar replay, most platforms provide 6 months to 5 years of historical data. For automated testing, platforms like TradeZella offer 11+ years across multiple asset classes.
- Execute the backtest consistently and without bias: For manual bar replay: replay the data bar by bar and take trades only when your pre-defined rules are met — not when the setup 'looks almost right.' Record every trade in a journal: entry price, exit price, reason for entry, reason for exit, and profit or loss. For automated backtesting: code or configure your rules in the platform and run the backtest. Review the individual trade log to check that the algorithm is correctly identifying the setups you intended.
- Accumulate at least 100 trades before drawing conclusions: TradeZella: 'At minimum 50 trades for a basic read. Ideally 100 or more for results you can trust.' If your strategy on a specific market and timeframe generates fewer than 100 trades in several years of data, consider whether the trade frequency is sufficient for live trading or whether you need to extend the test period or expand to additional instruments.
- Calculate and analyse the key metrics: From the trade log, calculate (or read from the platform's output): win rate, profit factor, expectancy per trade, maximum drawdown, average win, average loss, and R-multiple distribution. TradeZella generates these automatically. For manual backtests, a simple Excel spreadsheet can calculate all of these from the raw trade data. Assess whether the metrics meet your minimum thresholds: profit factor above 1.5, positive expectancy, maximum drawdown within your financial and psychological tolerance.
- Stress-test and optimise conservatively: Test the strategy across different date ranges, different market conditions, and (for automated strategies) different parameter settings. QuantifiedStrategies: 'Testing an equity strategy from 2008 to 2025 exposes it to multiple recessions, bull markets, and volatility spikes. This long sample helps distinguish genuine edge from strategies that happened to work during one favourable period.' Resist the temptation to over-optimise parameters to improve backtest results — this leads directly to the overfitting trap.
Worked Example: Backtesting a 20-Day SMA Pullback Strategy
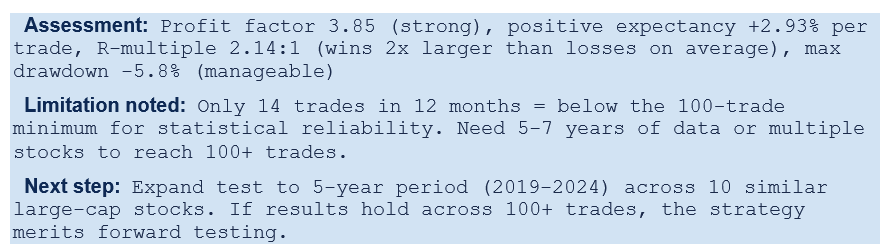
The following example illustrates a backtest of the moving average pullback strategy (one of the most widely backtested approaches) on a single S&P 500 stock over one year of daily data: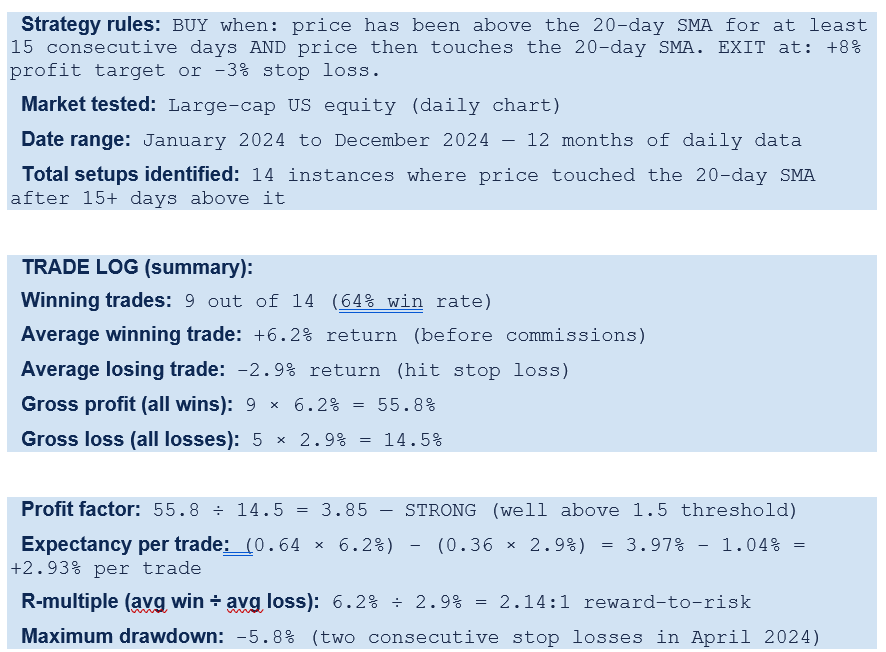
The Four Critical Backtesting Limitations Every Trader Must Know
Backtesting is the most important pre-trading validation tool available — but it has structural limitations that can produce dangerously misleading results if not understood and actively managed:- Overfitting (curve fitting) — the biggest danger: Overfitting occurs when a strategy is optimised so precisely to the historical data that it performs brilliantly on the test data but fails in live trading. TradeZella: 'Backtesting proves that a strategy had an edge in the past. It doesn't guarantee that edge will persist. Markets change, volatility regimes shift, and what worked in 2022 might not work in 2026.' The overfitting trap is most dangerous in automated backtesting where dozens of parameters can be adjusted. A strategy with 20 optimisable parameters can always be tuned to produce perfect results on any historical dataset — but those results are an artefact of optimisation, not evidence of a genuine edge. The guard against overfitting: use as few parameters as possible; test on out-of-sample data (a date range not used during optimisation); and validate that the strategy works across multiple instruments, not just one.
- Lookahead bias: Lookahead bias occurs when the backtest uses information that would not have been available to the trader at the moment of the trade. A common coding error: using the closing price of a bar to generate an entry signal that is then executed on the same bar's close — in reality, you cannot know the closing price until the bar is complete. For manual backtesting, the equivalent risk is that the trader unconsciously notices future price action while reviewing a chart and lets it influence their simulated entry decision. Bar replay platforms that hide future bars are specifically designed to prevent this.
- Slippage and commissions not fully captured: A backtest typically assumes entry and exit at the exact price the signal is generated. In live trading, slippage (the difference between the intended price and the actual execution price) and commissions reduce every trade's profitability. For high-frequency strategies, these costs can be the difference between a profitable and a losing approach. TradeZella notes: 'The impact of slippage and commissions at scale — though you can model these.' Any serious backtest should add realistic slippage and commission assumptions to the raw trade results.
- Past performance does not guarantee future performance: The most important and most frequently understated limitation. TradeZella is explicit: 'Markets change. A strategy that worked in 2023 might struggle in 2026.' Regulatory changes, market structure shifts, liquidity changes, the rise of algorithmic trading, and macro regime changes can all render previously profitable strategies ineffective. Backtesting across a wide range of historical conditions (including multiple market regimes) reduces but cannot eliminate this risk.
THE OVERFITTING TRAP — THE MOST DANGEROUS BACKTESTING MISTAKE: The most seductive and most destructive error in backtesting is optimising a strategy's parameters until the backtest results look perfect — then concluding that the strategy is reliable. An experienced trader once described this as 'fitting the map to the territory': the strategy has been adjusted until it perfectly describes the past, not because it captures a genuine market dynamic but because it has been calibrated to do so mathematically. The test: does the strategy work on data it has never seen? Divide your historical data into two periods. Use the first period for testing and optimisation. Then test the final, unmodified strategy on the second period (the out-of-sample period). If the results degrade significantly on the out-of-sample period, the strategy is likely overfitted. QuantifiedStrategies: 'The goal is to separate robust trading strategies from random luck. Testing an equity strategy from 2008 to 2025 exposes it to multiple recessions, bull markets, and volatility spikes.'
Backtesting vs Forward Testing (Paper Trading)
Backtesting and forward testing are sequential steps in the strategy validation process, not alternatives. A complete strategy development process uses both:Backtesting uses historical data to establish that the strategy has had an edge in the past. It is fast (automated tests run in seconds), comprehensive (covers years of data), and free of real financial risk. Its limitation is that it uses past data and may be subject to overfitting and lookahead bias.
Forward testing (also called paper trading or sim trading) applies the strategy to new, live market data in real time — but without risking real capital. The trader follows the strategy rules exactly as defined in the backtest and records every trade in real time. Forward testing cannot be gamed or retrospectively adjusted. It confirms whether the strategy's performance in backtesting reflects a genuine, forward-looking edge rather than an artefact of historical data fitting.
TradeZella's guide is explicit about the relationship: 'Backtesting is the process of applying a trading strategy to historical market data to measure how it would have performed. Forward testing — also called paper trading or sim trading — is the process of taking live trades with a defined strategy but without real money.' The recommended sequence: backtest first on 100+ historical trades → verify metrics meet thresholds (profit factor 1.5+, positive expectancy, drawdown within tolerance) → forward test for 50-100 live trades → if forward test metrics are consistent with backtesting, transition to live trading with appropriate position sizing.
THE STRATEGY VALIDATION SEQUENCE: Step 1 — Backtest on historical data (minimum 100 trades, multiple market conditions). Verify: profit factor > 1.5, positive expectancy, max drawdown within tolerance. Step 2 — Out-of-sample test (test the final, unmodified strategy on a date range not used during development). Verify results are consistent with the backtest period. Step 3 — Forward test (paper trade in real time for 50-100 trades following rules exactly). Verify real-time performance is consistent with backtest metrics. Step 4 — Live trading with minimum position size (typically 1/4 to 1/2 of intended full size). Monitor metrics monthly and compare to backtest expectations. Expand position size only when live metrics consistently match backtested expectations.
Conclusion
Backtesting is the most important analytical step a trader can take before committing real capital to a strategy. It replaces intuition and selective memory ('this setup has worked every time I've tried it') with statistical evidence across hundreds of trades in diverse market conditions — boom markets, crashes, sideways consolidations, high-volatility regimes, and low-volatility environments. QuantifiedStrategies captures the foundational principle: 'Professional traders at quantitative firms rarely deploy a new idea without first examining how it would have behaved historically. Even experienced discretionary traders benefit from testing their intuitions against past data.'The seven key metrics that every backtest should produce — win rate, profit factor, expectancy, maximum drawdown, R-multiple, sample size, and Sharpe ratio — together provide the complete statistical profile of a strategy's historical performance. TradeZella's July 2026 benchmarks give the practitioner the thresholds: profit factor above 1.5 is solid; 100+ trades is the minimum reliable sample; maximum drawdown establishes the foundation for drawdown management protocols. A strategy that clears all these thresholds on both in-sample and out-of-sample data has earned the right to be forward-tested with paper trades before going live.
The limitations of backtesting — overfitting, lookahead bias, slippage underestimation, and the fundamental uncertainty that past performance does not guarantee future results — are not reasons to skip it. They are reasons to conduct it rigorously, with appropriate humility about its conclusions. A strategy with no historical edge provides no basis whatsoever for live trading. A strategy with a documented, consistent, out-of-sample-tested edge provides a foundation — imperfect and uncertain, but genuinely better than guessing — for systematic live trading with defined risk management. That foundation is what backtesting builds.
0 Comments
Be the first to share your thoughts on this article.